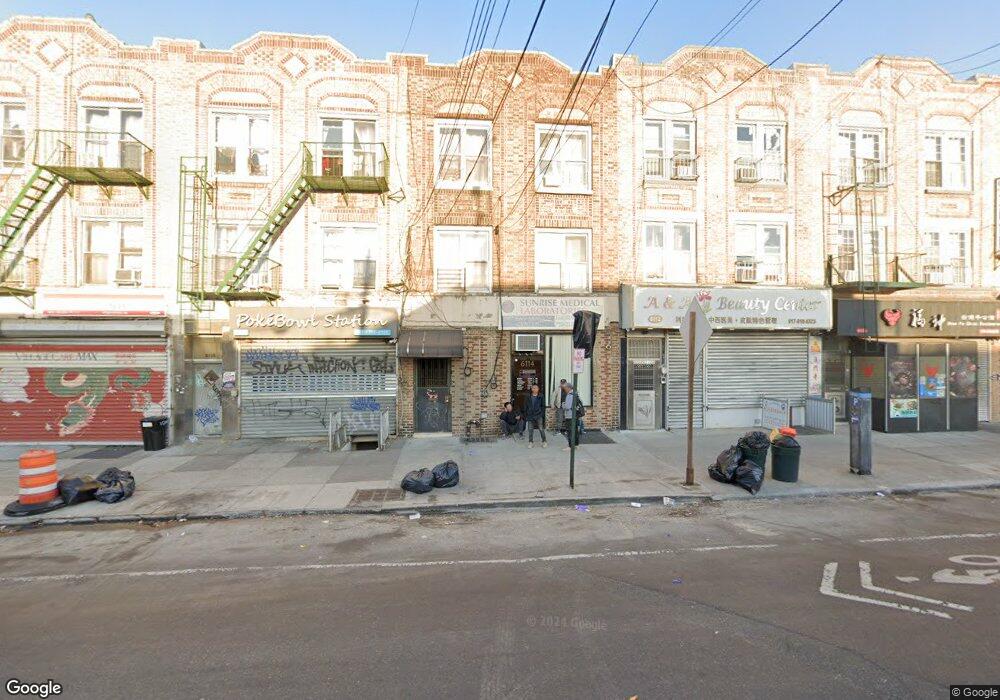
6116 7th Ave Brooklyn, NY 11220
Sunset Park NeighborhoodEstimated Value: $2,010,435
--
Bed
--
Bath
3,849
Sq Ft
$522/Sq Ft
Est. Value
About This Home
This home is located at 6116 7th Ave, Brooklyn, NY 11220 and is currently estimated at $2,010,435, approximately $522 per square foot. 6116 7th Ave is a home located in Kings County with nearby schools including P.S. 971 School of Math, Science, and Healthy Living, Fort Hamilton High School, and Success Academy Charter School - Bensonhurst.
Ownership History
Date
Name
Owned For
Owner Type
Purchase Details
Closed on
Sep 29, 2005
Sold by
Allen Deanna S and Ohrem Gordon K
Bought by
Brother & Sister 628 Corp
Current Estimated Value
Home Financials for this Owner
Home Financials are based on the most recent Mortgage that was taken out on this home.
Original Mortgage
$1,300,000
Outstanding Balance
$688,165
Interest Rate
5.78%
Mortgage Type
Purchase Money Mortgage
Estimated Equity
$1,322,270
Create a Home Valuation Report for This Property
The Home Valuation Report is an in-depth analysis detailing your home's value as well as a comparison with similar homes in the area
Home Values in the Area
Average Home Value in this Area
Purchase History
| Date | Buyer | Sale Price | Title Company |
|---|---|---|---|
| Brother & Sister 628 Corp | $950,000 | -- | |
| Brother & Sister 628 Corp | $950,000 | -- |
Source: Public Records
Mortgage History
| Date | Status | Borrower | Loan Amount |
|---|---|---|---|
| Open | Brother & Sister 628 Corp | $1,300,000 | |
| Closed | Brother & Sister 628 Corp | $1,300,000 |
Source: Public Records
Tax History Compared to Growth
Tax History
| Year | Tax Paid | Tax Assessment Tax Assessment Total Assessment is a certain percentage of the fair market value that is determined by local assessors to be the total taxable value of land and additions on the property. | Land | Improvement |
|---|---|---|---|---|
| 2025 | $7,110 | $148,680 | $22,560 | $126,120 |
| 2024 | $7,110 | $124,620 | $22,560 | $102,060 |
| 2023 | $6,789 | $123,420 | $22,560 | $100,860 |
| 2022 | $6,301 | $96,900 | $22,560 | $74,340 |
| 2021 | $6,273 | $87,000 | $22,560 | $64,440 |
| 2020 | $3,117 | $92,940 | $22,560 | $70,380 |
| 2019 | $6,171 | $90,720 | $22,560 | $68,160 |
| 2018 | $5,679 | $27,858 | $8,313 | $19,545 |
| 2017 | $5,362 | $26,304 | $8,417 | $17,887 |
| 2016 | $4,966 | $24,841 | $6,758 | $18,083 |
| 2015 | $2,993 | $24,832 | $10,136 | $14,696 |
| 2014 | $2,993 | $24,583 | $12,046 | $12,537 |
Source: Public Records
Map
Nearby Homes