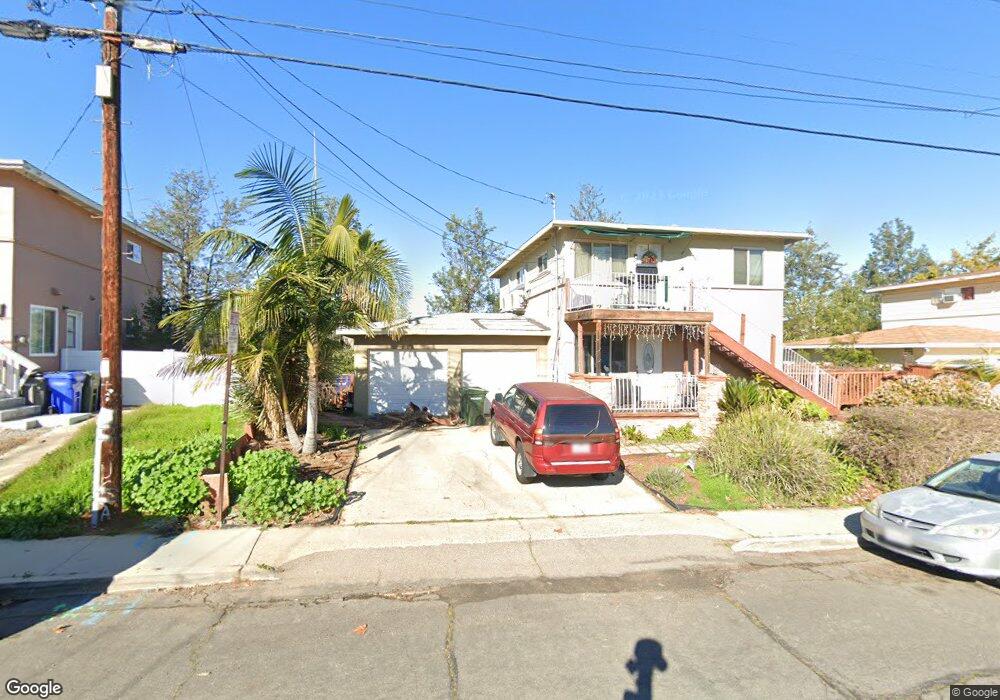
6116 Horton Dr Unit 18 La Mesa, CA 91942
Fletcher Hills NeighborhoodEstimated Value: $784,640 - $937,000
4
Beds
2
Baths
1,440
Sq Ft
$612/Sq Ft
Est. Value
About This Home
This home is located at 6116 Horton Dr Unit 18, La Mesa, CA 91942 and is currently estimated at $881,160, approximately $611 per square foot. 6116 Horton Dr Unit 18 is a home located in San Diego County with nearby schools including Northmont Elementary School, Parkway Academy, and Grossmont High School.
Ownership History
Date
Name
Owned For
Owner Type
Purchase Details
Closed on
Oct 22, 2019
Sold by
Snowden Harry M
Bought by
Snowden Harry Mark and Snowden Harry Mark
Current Estimated Value
Purchase Details
Closed on
Oct 19, 2009
Sold by
Federal National Mortgage Association
Bought by
Snowden Harry M
Purchase Details
Closed on
Oct 16, 2008
Sold by
Sallese Richard
Bought by
Federal National Mortgage Association
Purchase Details
Closed on
Oct 15, 1999
Sold by
Oh Mal Re
Bought by
Sallese Richard
Home Financials for this Owner
Home Financials are based on the most recent Mortgage that was taken out on this home.
Original Mortgage
$166,527
Interest Rate
7.82%
Mortgage Type
FHA
Purchase Details
Closed on
Jan 24, 1989
Purchase Details
Closed on
Aug 17, 1987
Purchase Details
Closed on
Oct 14, 1983
Create a Home Valuation Report for This Property
The Home Valuation Report is an in-depth analysis detailing your home's value as well as a comparison with similar homes in the area
Home Values in the Area
Average Home Value in this Area
Purchase History
| Date | Buyer | Sale Price | Title Company |
|---|---|---|---|
| Snowden Harry Mark | -- | None Available | |
| Snowden Harry M | $287,500 | Landsafe Title | |
| Federal National Mortgage Association | $354,237 | Accommodation | |
| Sallese Richard | $168,000 | First American Title | |
| -- | $167,000 | -- | |
| -- | $105,000 | -- | |
| -- | $75,000 | -- |
Source: Public Records
Mortgage History
| Date | Status | Borrower | Loan Amount |
|---|---|---|---|
| Previous Owner | Sallese Richard | $166,527 |
Source: Public Records
Tax History Compared to Growth
Tax History
| Year | Tax Paid | Tax Assessment Tax Assessment Total Assessment is a certain percentage of the fair market value that is determined by local assessors to be the total taxable value of land and additions on the property. | Land | Improvement |
|---|---|---|---|---|
| 2025 | $4,908 | $370,711 | $208,856 | $161,855 |
| 2024 | $4,908 | $363,443 | $204,761 | $158,682 |
| 2023 | $4,814 | $356,318 | $200,747 | $155,571 |
| 2022 | $4,824 | $349,332 | $196,811 | $152,521 |
| 2021 | $4,750 | $342,483 | $192,952 | $149,531 |
| 2020 | $4,629 | $338,972 | $190,974 | $147,998 |
| 2019 | $4,514 | $332,327 | $187,230 | $145,097 |
| 2018 | $4,328 | $325,811 | $183,559 | $142,252 |
| 2017 | $4,162 | $319,423 | $179,960 | $139,463 |
| 2016 | $3,997 | $313,161 | $176,432 | $136,729 |
| 2015 | $3,956 | $308,458 | $173,782 | $134,676 |
| 2014 | $3,882 | $302,416 | $170,378 | $132,038 |
Source: Public Records
Map
Nearby Homes
- 6130 Howell Dr
- 5654 Amaya Dr Unit 150
- 9348 Horton Dr
- 5931 Howell Dr Unit 14
- 5750 Amaya Dr Unit 10
- 6237 Falmouth Dr
- 282 Garfield Ave
- 188 Garden Grove Ln
- 9360 Monona Dr
- 8767 Blue Lake Dr
- 2394 Dryden Rd
- 198 Croydon Ln
- 6056 Winfield Ave
- 6232 Lake Athabaska Place
- 2213 Chatham St
- 275 Hihill Way
- 8706 Delta St
- 6354 Arms Lake Ave
- 9310 Wister Dr
- 0 Grossmont Unit PTP2505998
- 6116 Horton Dr
- 6120 Horton Dr Unit 22
- 6110 & 611 Horton Dr
- 6110 & 6112 Horton Dr
- 6110 Horton Dr Unit 12
- 6133 Severin Dr Unit 35
- 6125 Severin Dr Unit 27
- 6141 Severin Dr Unit 43
- 6132 Horton Dr
- 6130 Horton Dr
- 6117 Severin Dr Unit 19
- 6106 Horton Dr
- 6111 Horton Dr Unit 13
- 6117 Horton Dr Unit 19
- 6106-8 Horton Dr
- 6107 Horton Dr Unit 9
- 6145 Severin Dr Unit 47
- 6121 Horton Dr
- 6111 Severin Dr
- 6140 Horton Dr Unit 42