Estimated Value: $514,000 - $647,000
3
Beds
3
Baths
2,052
Sq Ft
$295/Sq Ft
Est. Value
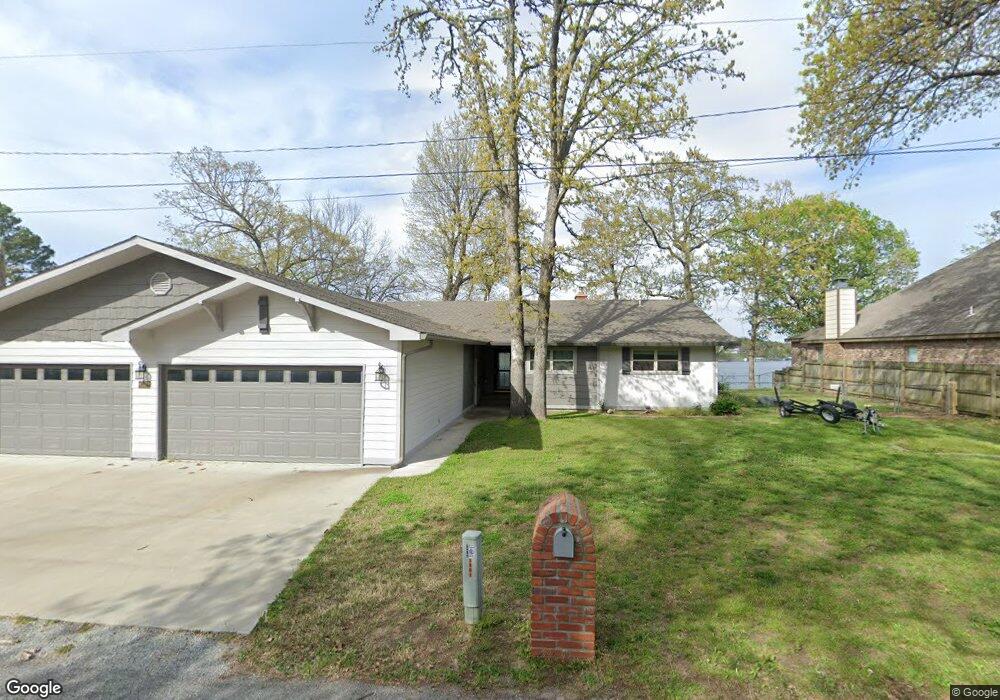
About This Home
This home is located at 61168 E 310 Rd, Grove, OK 74344 and is currently estimated at $604,503, approximately $294 per square foot. 61168 E 310 Rd is a home located in Delaware County with nearby schools including Grove Lower Elementary School, Grove Upper Elementary School, and Grove Middle School.
Ownership History
Date
Name
Owned For
Owner Type
Purchase Details
Closed on
Jul 31, 2023
Sold by
Lowther William R and Lowther Arletta K
Bought by
Lowther Family 2004 Trust and Lowther
Current Estimated Value
Purchase Details
Closed on
Nov 20, 2019
Sold by
Senger David A and Senger Sarah F
Bought by
Lowther William and Lowther Arletta
Home Financials for this Owner
Home Financials are based on the most recent Mortgage that was taken out on this home.
Original Mortgage
$130,000
Interest Rate
3.5%
Mortgage Type
New Conventional
Purchase Details
Closed on
Apr 5, 2008
Sold by
Sandberg J Theodore and Sandberg Sue Ann
Bought by
Senger David A and Senger Sarah F
Home Financials for this Owner
Home Financials are based on the most recent Mortgage that was taken out on this home.
Original Mortgage
$130,000
Interest Rate
6%
Mortgage Type
New Conventional
Purchase Details
Closed on
Sep 11, 1998
Sold by
Sandberg J Theodore
Create a Home Valuation Report for This Property
The Home Valuation Report is an in-depth analysis detailing your home's value as well as a comparison with similar homes in the area
Home Values in the Area
Average Home Value in this Area
Purchase History
| Date | Buyer | Sale Price | Title Company |
|---|---|---|---|
| Lowther Family 2004 Trust | -- | None Listed On Document | |
| Lowther William | $380,000 | Grand River Abstract & Ttl C | |
| Senger David A | $282,000 | -- | |
| -- | -- | -- |
Source: Public Records
Mortgage History
| Date | Status | Borrower | Loan Amount |
|---|---|---|---|
| Previous Owner | Lowther William | $130,000 | |
| Previous Owner | Senger David A | $130,000 |
Source: Public Records
Tax History
| Year | Tax Paid | Tax Assessment Tax Assessment Total Assessment is a certain percentage of the fair market value that is determined by local assessors to be the total taxable value of land and additions on the property. | Land | Improvement |
|---|---|---|---|---|
| 2025 | $4,716 | $58,244 | $14,806 | $43,438 |
| 2024 | $4,491 | $55,471 | $14,574 | $40,897 |
| 2023 | $4,491 | $43,701 | $14,088 | $29,613 |
| 2022 | $3,649 | $43,701 | $14,088 | $29,613 |
| 2021 | $3,641 | $43,701 | $14,088 | $29,613 |
| 2020 | $3,702 | $43,701 | $14,088 | $29,613 |
| 2019 | $2,014 | $24,683 | $11,510 | $13,173 |
| 2018 | $1,949 | $24,684 | $11,524 | $13,160 |
| 2017 | $1,896 | $23,964 | $11,319 | $12,645 |
| 2016 | $1,837 | $23,267 | $11,139 | $12,128 |
| 2015 | $1,773 | $21,541 | $10,523 | $11,018 |
| 2014 | $1,782 | $21,541 | $10,523 | $11,018 |
Source: Public Records
Map
Nearby Homes
- 61113 E 310 Rd
- 2720 Thompson Rd
- 25101 S 613
- 3110 Old Dike Rd
- 3114 Buffalo Ln
- 3112 Shore Dr
- 3400 Callie Dr
- 3126 Shore Dr
- 31797 S 598 Ct
- 61950 E 315 Rd
- 3456 Scenic Dr
- 1307 W 16th St
- 1709 Cardiac Cove Rd
- 3435 Scenic Dr
- 1621 Rockwood Dr
- 116 Anchor Rd
- 1429 Wood St
- 0 S Main St Unit 2603235
- 0 S Main St Unit 2601596
- 62000 E 315 Loop Unit 47