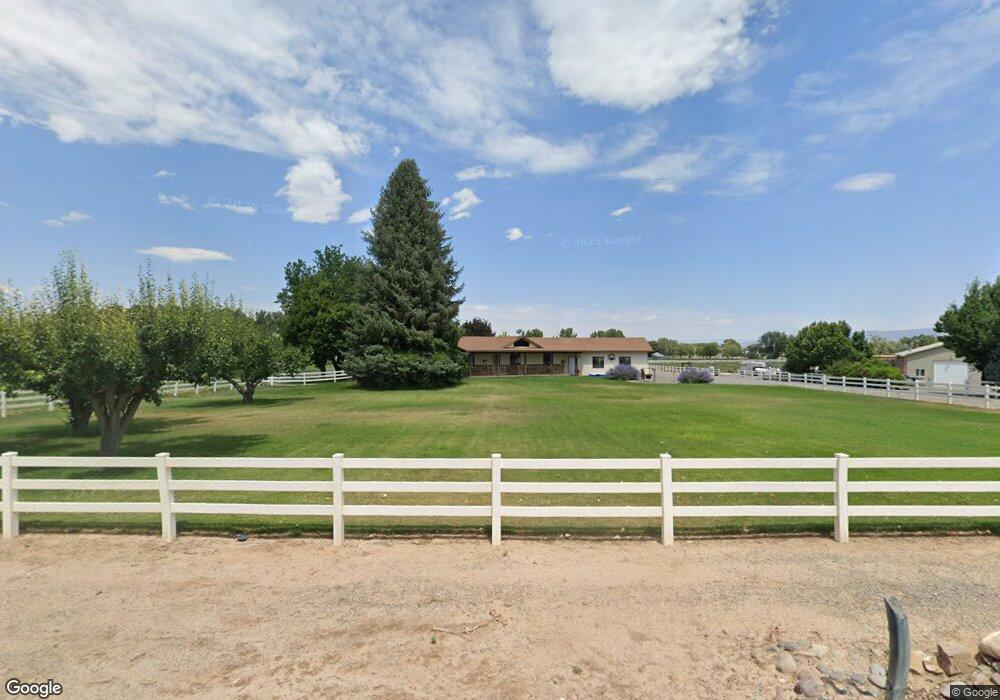
61189 Niagara Rd Montrose, CO 81403
Estimated Value: $864,566 - $994,000
3
Beds
3
Baths
3,520
Sq Ft
$265/Sq Ft
Est. Value
About This Home
This home is located at 61189 Niagara Rd, Montrose, CO 81403 and is currently estimated at $931,892, approximately $264 per square foot. 61189 Niagara Rd is a home located in Montrose County with nearby schools including Oak Grove Elementary School, Columbine Middle School, and Montrose High School.
Ownership History
Date
Name
Owned For
Owner Type
Purchase Details
Closed on
May 21, 2024
Sold by
Gary Duane Cooper Trust and Cooper Gary
Bought by
Cooper Gary and Cooper Kathy
Current Estimated Value
Home Financials for this Owner
Home Financials are based on the most recent Mortgage that was taken out on this home.
Original Mortgage
$163,000
Outstanding Balance
$160,808
Interest Rate
7.1%
Mortgage Type
New Conventional
Estimated Equity
$771,084
Purchase Details
Closed on
Jun 20, 2006
Sold by
Hanson Dennis G and Hanson Susan E
Bought by
Gary Duane Cooper Trust
Purchase Details
Closed on
Apr 5, 2004
Sold by
Whitticom James and Whitticom Patricia
Bought by
Hanson Dennis G and Hanson Susan E
Purchase Details
Closed on
Nov 18, 1994
Sold by
Brown Darel C and Brown Eleanor Jane
Bought by
Whitticom James and Whitticom Patricia
Purchase Details
Closed on
Mar 20, 1975
Bought by
Brown Darel C and Brown Eleanor Jane
Create a Home Valuation Report for This Property
The Home Valuation Report is an in-depth analysis detailing your home's value as well as a comparison with similar homes in the area
Home Values in the Area
Average Home Value in this Area
Purchase History
| Date | Buyer | Sale Price | Title Company |
|---|---|---|---|
| Cooper Gary | -- | None Listed On Document | |
| Gary Duane Cooper Trust | $455,000 | None Available | |
| Hanson Dennis G | $375,000 | -- | |
| Whitticom James | $272,000 | -- | |
| Brown Darel C | $33,400 | -- |
Source: Public Records
Mortgage History
| Date | Status | Borrower | Loan Amount |
|---|---|---|---|
| Open | Cooper Gary | $163,000 |
Source: Public Records
Tax History Compared to Growth
Tax History
| Year | Tax Paid | Tax Assessment Tax Assessment Total Assessment is a certain percentage of the fair market value that is determined by local assessors to be the total taxable value of land and additions on the property. | Land | Improvement |
|---|---|---|---|---|
| 2024 | $3,431 | $48,190 | $12,700 | $35,490 |
| 2023 | $3,431 | $53,810 | $14,180 | $39,630 |
| 2022 | $2,499 | $36,320 | $7,120 | $29,200 |
| 2021 | $2,576 | $37,370 | $7,330 | $30,040 |
| 2020 | $2,193 | $32,680 | $6,370 | $26,310 |
| 2019 | $2,207 | $32,680 | $6,370 | $26,310 |
| 2018 | $2,048 | $29,590 | $5,130 | $24,460 |
| 2017 | $2,032 | $29,590 | $5,130 | $24,460 |
| 2016 | $1,974 | $29,230 | $4,730 | $24,500 |
| 2015 | $1,941 | $29,230 | $4,730 | $24,500 |
| 2014 | $1,830 | $29,480 | $5,250 | $24,230 |
Source: Public Records
Map
Nearby Homes
- 15189 6125 Rd
- 60837 Nighthorse Ln
- 15067 6140 Ln
- TBD Niagara Rd
- 15090 6050 Rd
- 60245 Oak Grove Rd
- 62201 Chu Ln
- TBD Spring Creek Rd
- 61976 Highway 90
- 62592 N Star Dr
- Lot 2 Nectar Ct
- 62347 Nectar Ct
- Lot 7 6260 Rd
- 15183 6260 Rd
- 15103 6260 Rd
- Lot 2 6260 Rd
- 14444 6215 Rd
- TBD 6270 Rd
- 15567 6282 Rd
- 60497 Maple Grove Rd