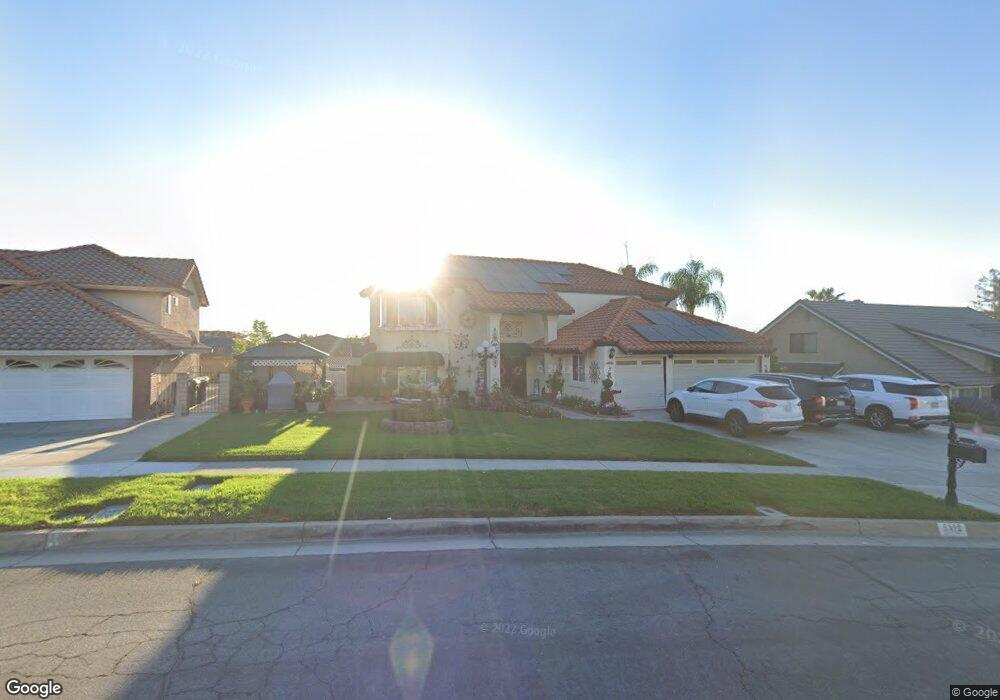
6119 Vineyard Ave Rancho Cucamonga, CA 91701
Alta Loma NeighborhoodEstimated Value: $871,592 - $1,058,000
4
Beds
3
Baths
2,482
Sq Ft
$391/Sq Ft
Est. Value
About This Home
This home is located at 6119 Vineyard Ave, Rancho Cucamonga, CA 91701 and is currently estimated at $970,648, approximately $391 per square foot. 6119 Vineyard Ave is a home located in San Bernardino County with nearby schools including Jasper Elementary, Alta Loma Junior High, and Alta Loma High School.
Ownership History
Date
Name
Owned For
Owner Type
Purchase Details
Closed on
Jul 20, 2021
Sold by
Morales Richard M and Morales Lorraine L
Bought by
Morales Richard M and Morales Lorraine L
Current Estimated Value
Home Financials for this Owner
Home Financials are based on the most recent Mortgage that was taken out on this home.
Original Mortgage
$300,100
Outstanding Balance
$272,294
Interest Rate
2.9%
Mortgage Type
New Conventional
Estimated Equity
$698,354
Purchase Details
Closed on
Jul 25, 2007
Sold by
Morales Richard M and Morales Lorraine L
Bought by
Morales Richard M and Morales Lorraine L
Purchase Details
Closed on
Dec 31, 1997
Sold by
Scheidler James W and Scheidler Karen M
Bought by
Morales Richard M and Morales Lorraine L
Home Financials for this Owner
Home Financials are based on the most recent Mortgage that was taken out on this home.
Original Mortgage
$184,000
Interest Rate
7.16%
Create a Home Valuation Report for This Property
The Home Valuation Report is an in-depth analysis detailing your home's value as well as a comparison with similar homes in the area
Home Values in the Area
Average Home Value in this Area
Purchase History
| Date | Buyer | Sale Price | Title Company |
|---|---|---|---|
| Morales Richard M | -- | Amrock Llc | |
| Morales Richard M | -- | Amrock Inc | |
| Morales Richard M | -- | None Available | |
| Morales Richard M | $230,000 | Fidelity National Title Ins |
Source: Public Records
Mortgage History
| Date | Status | Borrower | Loan Amount |
|---|---|---|---|
| Open | Morales Richard M | $300,100 | |
| Closed | Morales Richard M | $184,000 |
Source: Public Records
Tax History
| Year | Tax Paid | Tax Assessment Tax Assessment Total Assessment is a certain percentage of the fair market value that is determined by local assessors to be the total taxable value of land and additions on the property. | Land | Improvement |
|---|---|---|---|---|
| 2025 | $4,159 | $366,376 | $109,745 | $256,631 |
| 2024 | $4,057 | $359,192 | $107,593 | $251,599 |
| 2023 | $3,968 | $352,149 | $105,483 | $246,666 |
| 2022 | $3,957 | $345,244 | $103,415 | $241,829 |
| 2021 | $3,954 | $338,474 | $101,387 | $237,087 |
| 2020 | $3,797 | $335,003 | $100,347 | $234,656 |
| 2019 | $3,837 | $328,434 | $98,379 | $230,055 |
| 2018 | $3,753 | $321,994 | $96,450 | $225,544 |
| 2017 | $3,588 | $315,681 | $94,559 | $221,122 |
| 2016 | $3,494 | $309,491 | $92,705 | $216,786 |
| 2015 | $3,471 | $304,842 | $91,312 | $213,530 |
| 2014 | $3,376 | $298,870 | $89,523 | $209,347 |
Source: Public Records
Map
Nearby Homes
- 6109 Vineyard Ave
- 8867 Mandarin Ave
- 6340 Sacramento Ave
- 6036 Eastwood Ave
- 5848 Burlwood Ct
- 5836 Buckthorn Ave
- 8607 Buggy Whip Rd
- 8635 Orange St
- 8771 Rancho St
- 9379 Monarch Ct
- 6620 Altawoods Way
- 6275 Sapphire St
- 9111 Hamilton St
- 6815 Coral Ct
- 6154 Klusman Ave
- 8979 Camellia Ct
- 6870 Saddleback Place
- 8985 Sage Dr
- 6833 Carnelian St
- 9588 Highland Ave
- 6129 Vineyard Ave
- 6120 Balboa Ct
- 6126 Balboa Ct
- 6110 Balboa Ct
- 6139 Vineyard Ave
- 6118 Vineyard Ave
- 6136 Balboa Ct
- 6128 Vineyard Ave
- 6147 Vineyard Ave
- 6087 Vineyard Ave
- 6148 Balboa Ct
- 6138 Vineyard Ave
- 6088 Vineyard Ave
- 6159 Vineyard Ave
- 6121 Balboa Ct
- 6111 Balboa Ct
- 6127 Balboa Ct
- 6123 Cabrillo Ct
- 6111 Cabrillo Ct
- 6146 Vineyard Ave