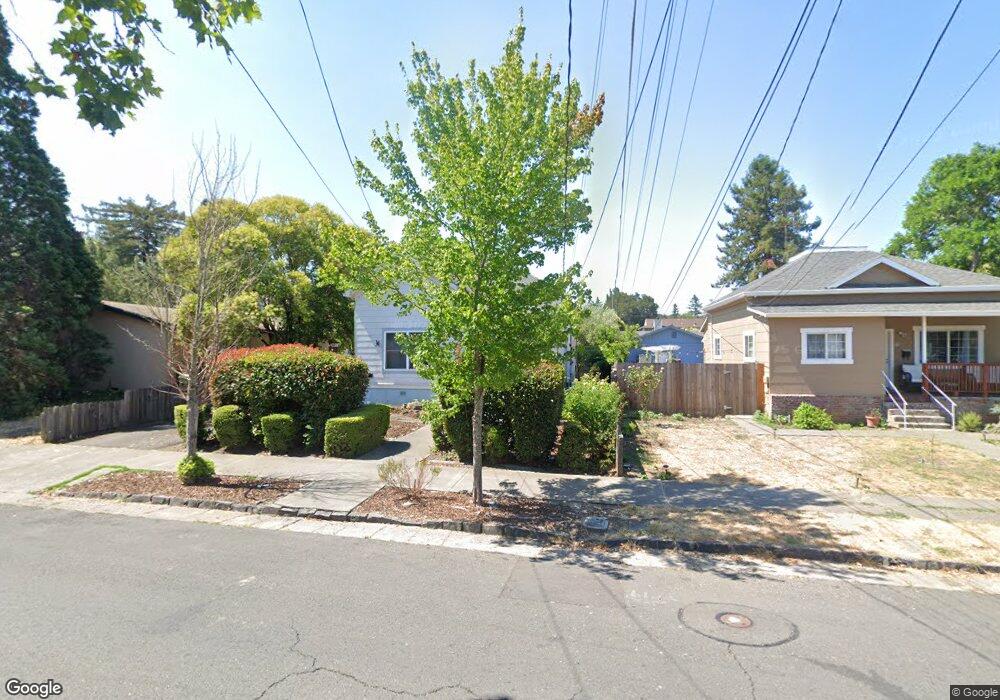
612 6th St Petaluma, CA 94952
Western Petaluma NeighborhoodEstimated Value: $912,000 - $1,073,000
3
Beds
2
Baths
1,830
Sq Ft
$529/Sq Ft
Est. Value
About This Home
This home is located at 612 6th St, Petaluma, CA 94952 and is currently estimated at $967,316, approximately $528 per square foot. 612 6th St is a home located in Sonoma County with nearby schools including McNear Elementary School, Petaluma Junior High School, and Petaluma High School.
Ownership History
Date
Name
Owned For
Owner Type
Purchase Details
Closed on
Mar 18, 2004
Sold by
Dolcini William M and Dolcini Stacie
Bought by
Stanley Barbara I and Price Rachel I
Current Estimated Value
Purchase Details
Closed on
Sep 15, 1999
Sold by
Dolcini Jason E
Bought by
Dolcini William M and Dolcini Stacie
Home Financials for this Owner
Home Financials are based on the most recent Mortgage that was taken out on this home.
Original Mortgage
$80,000
Interest Rate
8.09%
Purchase Details
Closed on
Jan 6, 1999
Sold by
Dolcini William M and Dolcini Georgia
Bought by
Dolcini William M and Dolcini Stacie
Purchase Details
Closed on
Apr 10, 1995
Sold by
Nelson Stanley and Nelson Barbara
Bought by
Dolcini William M and Dolcini William M
Home Financials for this Owner
Home Financials are based on the most recent Mortgage that was taken out on this home.
Original Mortgage
$68,000
Interest Rate
8.77%
Create a Home Valuation Report for This Property
The Home Valuation Report is an in-depth analysis detailing your home's value as well as a comparison with similar homes in the area
Home Values in the Area
Average Home Value in this Area
Purchase History
| Date | Buyer | Sale Price | Title Company |
|---|---|---|---|
| Stanley Barbara I | $570,000 | Old Republic Title Company | |
| Dolcini William M | -- | First American Title Co | |
| Dolcini William M | -- | -- | |
| Dolcini William M | $170,000 | Northwestern Title Company |
Source: Public Records
Mortgage History
| Date | Status | Borrower | Loan Amount |
|---|---|---|---|
| Previous Owner | Dolcini William M | $80,000 | |
| Previous Owner | Dolcini William M | $68,000 |
Source: Public Records
Tax History
| Year | Tax Paid | Tax Assessment Tax Assessment Total Assessment is a certain percentage of the fair market value that is determined by local assessors to be the total taxable value of land and additions on the property. | Land | Improvement |
|---|---|---|---|---|
| 2025 | $8,759 | $810,408 | $568,711 | $241,697 |
| 2024 | $8,759 | $794,518 | $557,560 | $236,958 |
| 2023 | $8,759 | $778,940 | $546,628 | $232,312 |
| 2022 | $8,496 | $763,667 | $535,910 | $227,757 |
| 2021 | $8,337 | $748,694 | $525,402 | $223,292 |
| 2020 | $8,409 | $741,018 | $520,015 | $221,003 |
| 2019 | $8,305 | $726,489 | $509,819 | $216,670 |
| 2018 | $8,273 | $712,245 | $499,823 | $212,422 |
| 2017 | $8,100 | $698,280 | $490,023 | $208,257 |
| 2016 | $7,912 | $684,589 | $480,415 | $204,174 |
| 2015 | $7,802 | $674,307 | $473,199 | $201,108 |
| 2014 | $6,773 | $575,000 | $404,000 | $171,000 |
Source: Public Records
Map
Nearby Homes
- 21 Branching Way
- 720 Petaluma Blvd S Unit 28
- 618 E St
- 426 1st St
- 16 7th St
- 11 10th St
- 0 Lakeville St
- 1021 Mcnear Ave
- 1309 D Street Extension
- 534 Jade St
- 131 Liberty St
- 136 Court St
- 320 Vallejo St
- 316 Vallejo St
- 22 Oak Knoll Ct
- 45 Augusta Cir
- 100 Orchard Ln
- 417 Jacquelyn Ln
- 12 Haven Dr
- 712 E Washington St
Your Personal Tour Guide
Ask me questions while you tour the home.