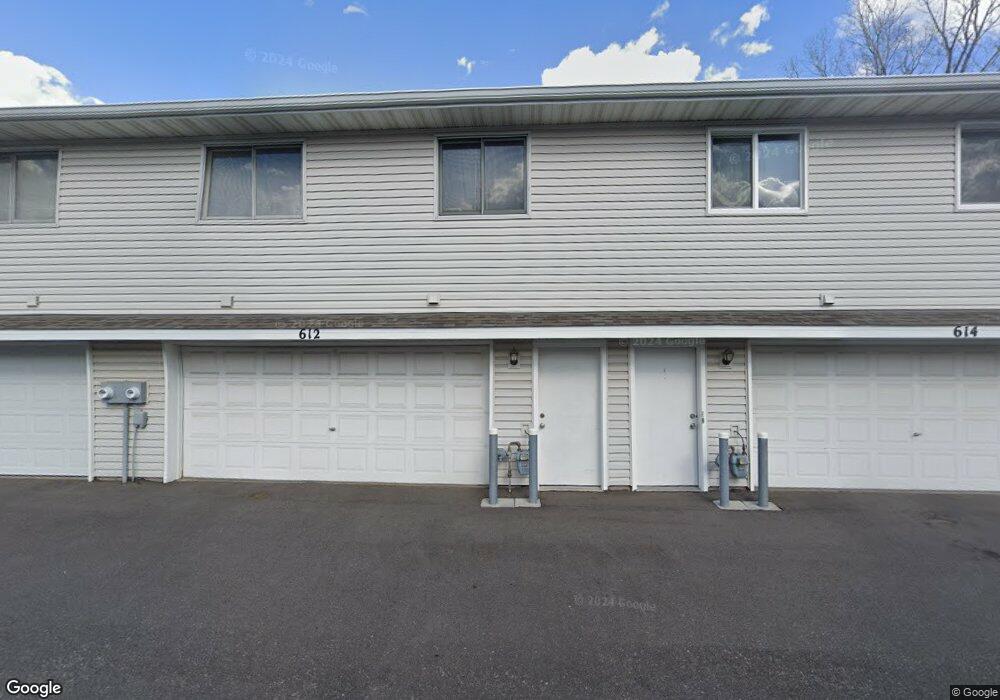
612 78th Ave NE Minneapolis, MN 55432
Estimated Value: $224,000 - $237,000
2
Beds
1
Bath
1,350
Sq Ft
$170/Sq Ft
Est. Value
About This Home
This home is located at 612 78th Ave NE, Minneapolis, MN 55432 and is currently estimated at $229,794, approximately $170 per square foot. 612 78th Ave NE is a home located in Anoka County with nearby schools including Park Terrace Elementary School, Westwood Intermediate and Middle School, and Grace Lutheran School.
Ownership History
Date
Name
Owned For
Owner Type
Purchase Details
Closed on
Feb 9, 2022
Sold by
Opendoor Property C Llc
Bought by
Buchner Joseph
Current Estimated Value
Home Financials for this Owner
Home Financials are based on the most recent Mortgage that was taken out on this home.
Original Mortgage
$218,900
Outstanding Balance
$203,290
Interest Rate
3.56%
Mortgage Type
New Conventional
Estimated Equity
$26,504
Purchase Details
Closed on
Aug 30, 2021
Sold by
Ogren Jens N
Bought by
Opendoor Property C Llc
Purchase Details
Closed on
Dec 30, 2008
Sold by
Smisek Sherry A
Bought by
Ogren Jens N
Home Financials for this Owner
Home Financials are based on the most recent Mortgage that was taken out on this home.
Original Mortgage
$108,550
Interest Rate
5.53%
Mortgage Type
FHA
Create a Home Valuation Report for This Property
The Home Valuation Report is an in-depth analysis detailing your home's value as well as a comparison with similar homes in the area
Home Values in the Area
Average Home Value in this Area
Purchase History
| Date | Buyer | Sale Price | Title Company |
|---|---|---|---|
| Buchner Joseph | $221,100 | -- | |
| Opendoor Property C Llc | $220,200 | None Available | |
| Ogren Jens N | $110,000 | -- | |
| -- | $220,200 | -- |
Source: Public Records
Mortgage History
| Date | Status | Borrower | Loan Amount |
|---|---|---|---|
| Open | Buchner Joseph | $218,900 | |
| Previous Owner | Ogren Jens N | $108,550 |
Source: Public Records
Tax History Compared to Growth
Tax History
| Year | Tax Paid | Tax Assessment Tax Assessment Total Assessment is a certain percentage of the fair market value that is determined by local assessors to be the total taxable value of land and additions on the property. | Land | Improvement |
|---|---|---|---|---|
| 2025 | $2,155 | $210,400 | $46,100 | $164,300 |
| 2024 | $2,155 | $203,000 | $46,100 | $156,900 |
| 2023 | $1,854 | $200,800 | $46,200 | $154,600 |
| 2022 | $2,007 | $190,300 | $30,600 | $159,700 |
| 2021 | $1,819 | $153,300 | $14,100 | $139,200 |
| 2020 | $1,908 | $138,500 | $12,900 | $125,600 |
| 2019 | $1,856 | $136,400 | $14,100 | $122,300 |
| 2018 | $1,665 | $128,800 | $0 | $0 |
| 2017 | $1,659 | $108,100 | $0 | $0 |
| 2016 | $1,341 | $82,900 | $0 | $0 |
| 2015 | $1,189 | $82,900 | $22,300 | $60,600 |
| 2014 | -- | $73,200 | $19,000 | $54,200 |
Source: Public Records
Map
Nearby Homes
- 601 79th Ave NE
- 7733 Quincy St NE
- 7811 Jackson St NE
- 7720 Van Buren St NE
- 8032 Madison St NE
- 7717 Able St NE
- 8032 Van Buren St NE
- 358 81st Ave NE
- 380 74th Ave NE
- 1010 North Cir NE
- 857 81st Ave NE
- 7436 West Cir NE
- 7324 West Cir NE Unit K324
- 7317 West Cir NE Unit K317
- 8157 Taylor St NE
- 8132 Fillmore St NE
- 7310 Taylor St NE
- 8351 6th St NE
- 516 84th Ave NE
- 8380 6th St NE
- 610 78th Ave NE
- 608 78th Ave NE
- 614 78th Ave NE
- 606 78th Ave NE
- 616 78th Ave NE
- 604 78th Ave NE
- 618 78th Ave NE
- 590 78th Ave NE
- 592 78th Ave NE
- 602 78th Ave NE
- 588 78th Ave NE
- 594 78th Ave NE
- 586 78th Ave NE
- 596 78th Ave NE
- 600 78th Ave NE
- 584 78th Ave NE
- 598 78th Ave NE
- 582 78th Ave NE
- 580 78th Ave NE
- 570 78th Ave NE