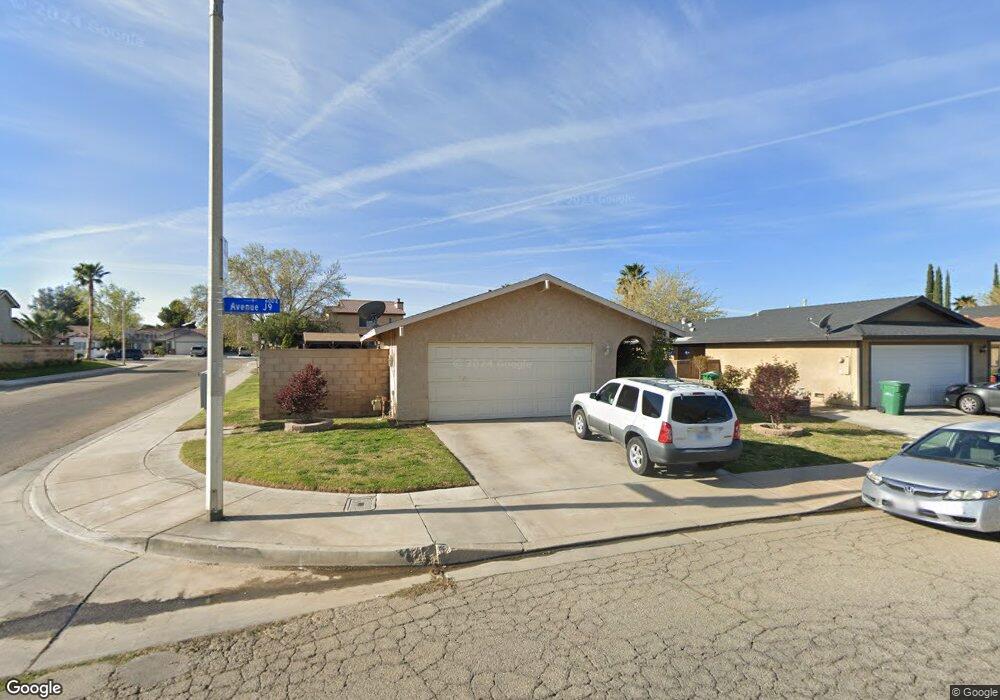
612 E Avenue j9 Lancaster, CA 93535
East Lancaster NeighborhoodEstimated Value: $394,000 - $423,000
About This Home
This home is located at 612 E Avenue j9, Lancaster, CA 93535 and is currently estimated at $411,053, approximately $358 per square foot. 612 E Avenue j9 is a home located in Los Angeles County with nearby schools including Joshua Elementary, New Vista Middle School, and Antelope Valley High School.
Ownership History
We collect this data history from publicly available records. To have your information removed, we recommend requesting removal directly through your county’s website.
Purchase Details
Home Financials for this Owner
Home Financials are based on the most recent Mortgage that was taken out on this home.Purchase Details
Purchase Details
Purchase Details
Home Values in the Area
Average Home Value in this Area
Purchase History
We collect this data history from publicly available records. To have your information removed, we recommend requesting removal directly through your county’s website.
| Date | Buyer | Sale Price | Title Company |
|---|---|---|---|
| $90,000 | Stewart Title | ||
| -- | Benevest Title | ||
| $97,422 | Benefit Land Title Co | ||
| $13,371 | Chicago Title |
Mortgage History
We collect this data history from publicly available records. To have your information removed, we recommend requesting removal directly through your county’s website.
| Date | Status | Borrower | Loan Amount |
|---|---|---|---|
| Closed | $91,513 |
Tax History
We collect this data history from publicly available records. To have your information removed, we recommend requesting removal directly through your county’s website.
| Year | Tax Paid | Tax Assessment Tax Assessment Total Assessment is a certain percentage of the fair market value that is determined by local assessors to be the total taxable value of land and additions on the property. | Land | Improvement |
|---|---|---|---|---|
| 2025 | $3,859 | $198,315 | $30,721 | $167,594 |
| 2024 | $3,701 | $194,427 | $30,119 | $164,308 |
| 2023 | $3,624 | $190,616 | $29,529 | $161,087 |
| 2022 | $3,427 | $186,879 | $28,950 | $157,929 |
| 2021 | $3,040 | $183,216 | $28,383 | $154,833 |
| 2019 | $2,956 | $177,784 | $27,542 | $150,242 |
| 2018 | $2,904 | $174,299 | $27,002 | $147,297 |
| 2016 | $2,758 | $167,532 | $25,954 | $141,578 |
| 2015 | $2,638 | $157,700 | $24,400 | $133,300 |
| 2014 | $2,663 | $157,700 | $24,400 | $133,300 |
Map
- 606 E Avenue j9
- 567 E Avenue j9
- 660 E Avenue j10
- 44047 Rodin Ave
- 43903 5th St E
- 44008 Raysack Ave
- 443 Corona Ct
- 44117 Sancroft Ave
- 736 E Avenue j6
- 44025 Glenraven Rd
- 43737 Raysack Ave
- 43731 8th St E
- 43652 Andale Ave
- 43650 5th St E
- 834 E Avenue j6
- 43637 6th St E
- 0 7th St East @ J-14 Unit 26001768
- 0 10th St East @ Ave J11 (Challenger) Unit 26002041
- 0 10th St E Unit SR25172836
- 0 10th St E Unit PW25091742
- 600 E Avenue j9
- 564 E Avenue j9
- 558 E Avenue j9
- 603 E Avenue j10
- 609 E Avenue j10
- 563 E Avenue j10
- 615 E Avenue j10
- 557 E Avenue j10
- 611 E Avenue j9
- 563 E Avenue j9
- 551 E Avenue j10
- 551 E Avenue j10
- 624 E Avenue j9
- 544 E Avenue j9
- 619 E Avenue j9
- 557 E Avenue j9
- 625 E Avenue j10
- 545 E Avenue j10
- 627 E Avenue j9
- 551 E Avenue j9
Ask me questions while you tour the home.