Estimated Value: $369,694 - $429,000
3
Beds
2
Baths
2,084
Sq Ft
$194/Sq Ft
Est. Value
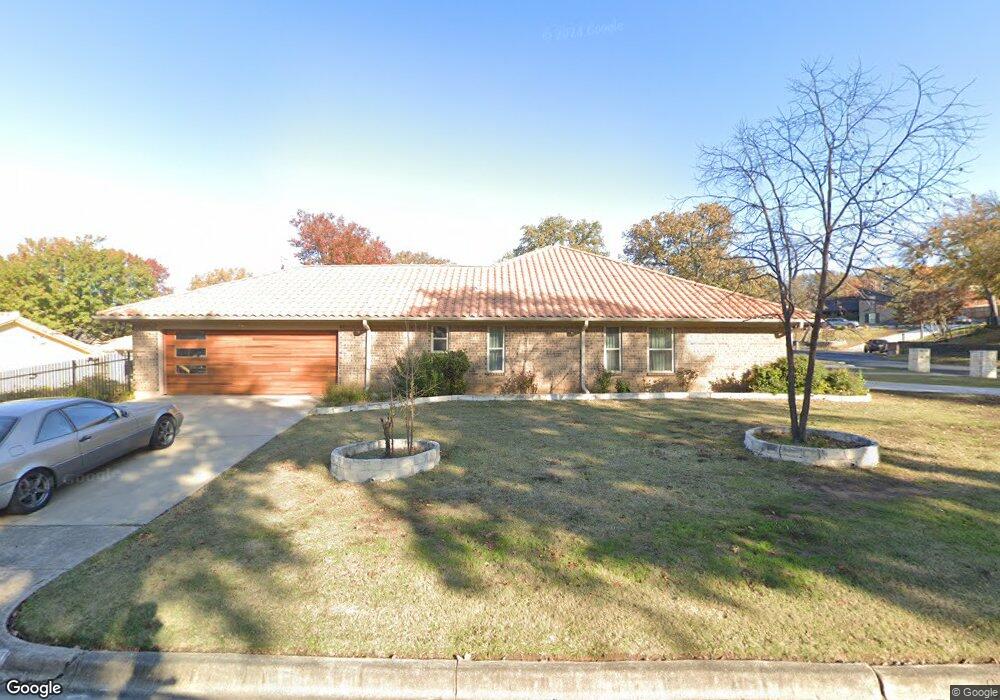
About This Home
This home is located at 612 Fairlane Ct, Hurst, TX 76054 and is currently estimated at $404,424, approximately $194 per square foot. 612 Fairlane Ct is a home located in Tarrant County with nearby schools including Walker Creek Elementary School, Smithfield Middle School, and Birdville High School.
Ownership History
Date
Name
Owned For
Owner Type
Purchase Details
Closed on
Sep 7, 2005
Sold by
Leung Anna
Bought by
Tabar Mike
Current Estimated Value
Home Financials for this Owner
Home Financials are based on the most recent Mortgage that was taken out on this home.
Original Mortgage
$116,800
Interest Rate
5.8%
Mortgage Type
Fannie Mae Freddie Mac
Purchase Details
Closed on
Sep 22, 2003
Sold by
Nguyen Hai Ngoe
Bought by
Leung Anna
Home Financials for this Owner
Home Financials are based on the most recent Mortgage that was taken out on this home.
Original Mortgage
$14,600
Interest Rate
5.88%
Mortgage Type
Stand Alone Second
Purchase Details
Closed on
Jun 5, 2003
Sold by
Luong Gihai N
Bought by
Nguyen Hai N
Purchase Details
Closed on
Jun 19, 2001
Sold by
Nationwide Affordable Housing Inc
Bought by
Leung Anna
Create a Home Valuation Report for This Property
The Home Valuation Report is an in-depth analysis detailing your home's value as well as a comparison with similar homes in the area
Home Values in the Area
Average Home Value in this Area
Purchase History
| Date | Buyer | Sale Price | Title Company |
|---|---|---|---|
| Tabar Mike | -- | First Land Title | |
| Leung Anna | -- | First Land Title | |
| Nguyen Hai N | -- | -- | |
| Leung Anna | -- | -- |
Source: Public Records
Mortgage History
| Date | Status | Borrower | Loan Amount |
|---|---|---|---|
| Closed | Tabar Mike | $116,800 | |
| Previous Owner | Leung Anna | $14,600 |
Source: Public Records
Tax History
| Year | Tax Paid | Tax Assessment Tax Assessment Total Assessment is a certain percentage of the fair market value that is determined by local assessors to be the total taxable value of land and additions on the property. | Land | Improvement |
|---|---|---|---|---|
| 2025 | $7,384 | $220,000 | $75,000 | $145,000 |
| 2024 | $7,384 | $325,000 | $75,000 | $250,000 |
| 2023 | $7,428 | $325,000 | $55,000 | $270,000 |
| 2022 | $7,417 | $300,000 | $55,000 | $245,000 |
| 2021 | $7,574 | $291,963 | $55,000 | $236,963 |
| 2020 | $6,844 | $266,339 | $55,000 | $211,339 |
| 2019 | $7,302 | $277,807 | $55,000 | $222,807 |
| 2018 | $6,308 | $240,000 | $55,000 | $185,000 |
| 2017 | $5,759 | $215,826 | $18,000 | $197,826 |
| 2016 | $5,393 | $202,108 | $18,000 | $184,108 |
| 2015 | $4,557 | $169,900 | $18,000 | $151,900 |
| 2014 | $4,557 | $169,900 | $18,000 | $151,900 |
Source: Public Records
Map
Nearby Homes
- 2221 Farrington Ln
- 2244 Hurstview Dr
- 2157 Lookout Ct
- 2201 Mountainview Dr
- 2204 Mountainview Dr
- 617 Indian Trail
- 317 Northglen Dr
- 421 Cavender Ct
- 404 Mountainview Dr
- 2620 Brookridge Dr
- 200 Eagle Ct
- 1905 Cimarron Trail
- 6400 Rogers Dr
- 712 Springhill Dr
- 736 Springhill Dr
- 6350 Rogers Dr
- 305 Warbler Dr
- 440 W Louella Dr
- 8920 Martin Dr
- 753 Toni Dr
- 608 Fairlane Ct
- 2232 Farrington Ln
- 2236 Farrington Ln
- 2236 Farrington Ln
- 617 Fairlane Ct
- 621 Fairlane Ct
- 609 Fairlane Ct
- 613 Fairlane Ct
- 604 Fairlane Ct
- 605 Fairlane Ct
- 625 Fairlane Ct
- 2240 Farrington Ln
- 600 Fairlane Ct
- 2233 Hurstview Dr
- 2229 Hurstview Dr
- 2237 Hurstview Dr
- 2233 Farrington Ln
- 2220 Farrington Ln
- 2237 Farrington Ln
- 601 Fairlane Ct
Your Personal Tour Guide
Ask me questions while you tour the home.