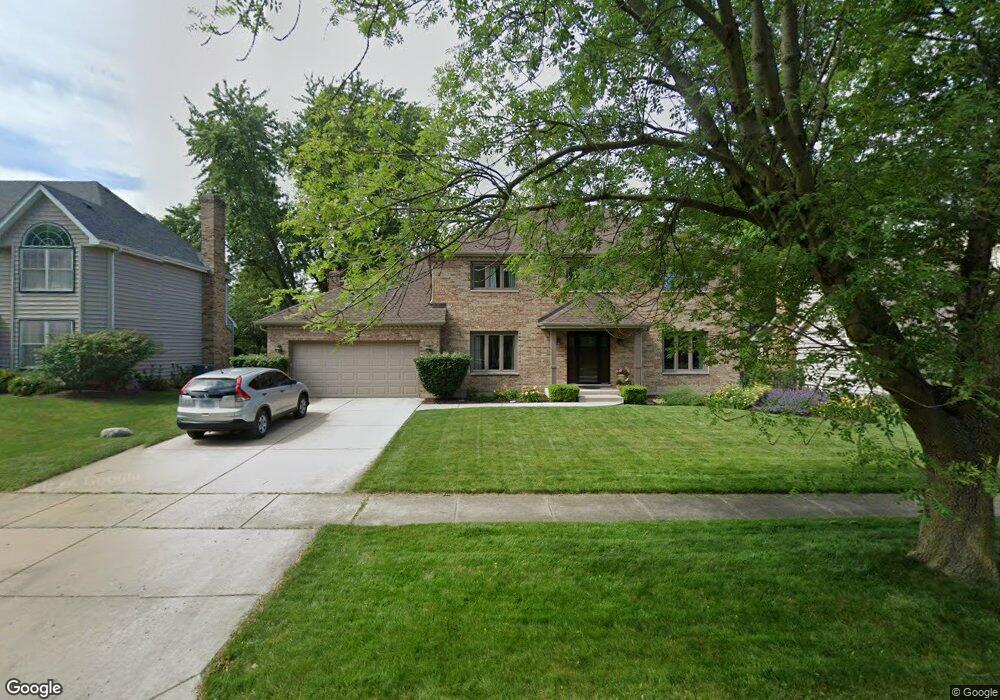
612 Flock Ave Naperville, IL 60565
Winding Creek Estates NeighborhoodEstimated Value: $746,000 - $850,000
5
Beds
4
Baths
2,845
Sq Ft
$281/Sq Ft
Est. Value
About This Home
This home is located at 612 Flock Ave, Naperville, IL 60565 and is currently estimated at $800,570, approximately $281 per square foot. 612 Flock Ave is a home located in DuPage County with nearby schools including Maplebrook Elementary School, Lincoln Jr. High School, and Naperville Central High School.
Ownership History
Date
Name
Owned For
Owner Type
Purchase Details
Closed on
Jun 5, 2008
Sold by
Erwin Kevin L and Erwin Dona J
Bought by
Kennedy Patrick and Kennedy Lucy
Current Estimated Value
Home Financials for this Owner
Home Financials are based on the most recent Mortgage that was taken out on this home.
Original Mortgage
$345,000
Outstanding Balance
$221,385
Interest Rate
6.05%
Mortgage Type
Purchase Money Mortgage
Estimated Equity
$579,185
Purchase Details
Closed on
Aug 21, 1998
Sold by
Parizek James J and Parizek Mary M
Bought by
Erwin Kevin L and Erwin Dona J
Home Financials for this Owner
Home Financials are based on the most recent Mortgage that was taken out on this home.
Original Mortgage
$250,000
Interest Rate
7.03%
Purchase Details
Closed on
Jun 4, 1996
Sold by
Parizek James J and Parizek Mary M
Bought by
Parizek James J and Parizek Marty M
Create a Home Valuation Report for This Property
The Home Valuation Report is an in-depth analysis detailing your home's value as well as a comparison with similar homes in the area
Home Values in the Area
Average Home Value in this Area
Purchase History
| Date | Buyer | Sale Price | Title Company |
|---|---|---|---|
| Kennedy Patrick | $480,000 | Pntn | |
| Erwin Kevin L | $287,000 | Law Title Pick Up | |
| Parizek James J | -- | -- |
Source: Public Records
Mortgage History
| Date | Status | Borrower | Loan Amount |
|---|---|---|---|
| Open | Kennedy Patrick | $345,000 | |
| Previous Owner | Erwin Kevin L | $250,000 |
Source: Public Records
Tax History
| Year | Tax Paid | Tax Assessment Tax Assessment Total Assessment is a certain percentage of the fair market value that is determined by local assessors to be the total taxable value of land and additions on the property. | Land | Improvement |
|---|---|---|---|---|
| 2024 | $12,541 | $212,709 | $78,584 | $134,125 |
| 2023 | $12,095 | $194,130 | $71,720 | $122,410 |
| 2022 | $11,091 | $177,370 | $65,530 | $111,840 |
| 2021 | $10,688 | $170,660 | $63,050 | $107,610 |
| 2020 | $10,462 | $167,600 | $61,920 | $105,680 |
| 2019 | $10,159 | $160,350 | $59,240 | $101,110 |
| 2018 | $10,162 | $160,350 | $59,240 | $101,110 |
| 2017 | $9,960 | $154,940 | $57,240 | $97,700 |
| 2016 | $9,763 | $149,340 | $55,170 | $94,170 |
| 2015 | $9,705 | $140,630 | $51,950 | $88,680 |
| 2014 | $9,815 | $137,870 | $50,930 | $86,940 |
| 2013 | $9,668 | $138,200 | $51,050 | $87,150 |
Source: Public Records
Map
Nearby Homes
- 628 Flock Ave Unit 3
- 332 Prairie Knoll Dr
- 381 Prairie Knoll Dr
- 289 Winding Creek Dr
- 77 Bluebird Ln
- 48 Starling Ln
- 534 Grimes Ave
- 2057 Lancaster Cir Unit 101C
- 1754 S Washington St Unit 1754
- 124 E Bailey Rd Unit E
- 2221 Woodland Cir
- 138 E Bailey Rd Unit M
- 47 Glencoe Ct Unit 102D
- 2245 Petworth Ct Unit 202C
- 144 E Bailey Rd Unit D
- 264 E Bailey Rd Unit C
- 34 Glencoe Ct Unit 202B
- 96 Midhurst Ct Unit 201
- 321 Carriage Hill Rd
- 313 W Gartner Rd
- 616 Flock Ave Unit 3
- 608 Flock Ave
- 1536 Placer Ct
- 1541 Placer Ct
- 620 Flock Ave
- 604 Flock Ave
- 613 Flock Ave Unit 3
- 617 Flock Ave
- 1532 Placer Ct
- 609 Flock Ave Unit 3
- 621 Flock Ave Unit 3
- 624 Flock Ave
- 605 Flock Ave
- 1537 Placer Ct
- 625 Flock Ave
- 600 Flock Ave
- 1532 Riparian Dr
- 1528 Placer Ct
- 435 Quail Dr Unit 5
- 1528 Riparian Dr
Your Personal Tour Guide
Ask me questions while you tour the home.