Estimated Value: $190,000 - $232,000
3
Beds
3
Baths
2,118
Sq Ft
$102/Sq Ft
Est. Value
About This Home
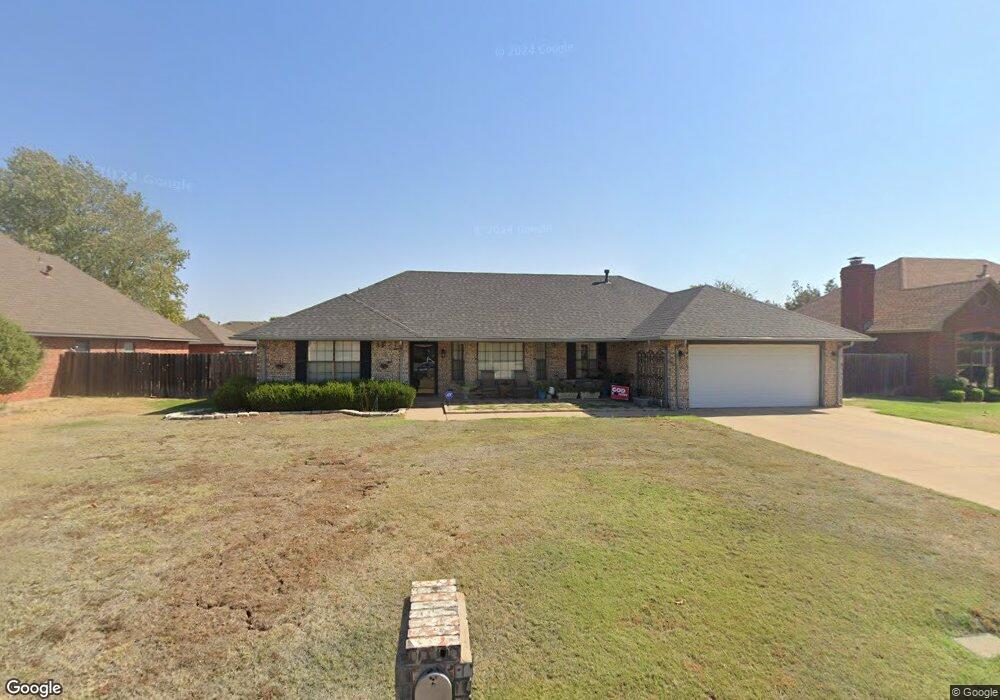
This home is located at 612 Hayes St, Altus, OK 73521 and is currently estimated at $216,571, approximately $102 per square foot. 612 Hayes St is a home located in Jackson County with nearby schools including Altus High School and Altus Christian Academy.
Ownership History
Date
Name
Owned For
Owner Type
Purchase Details
Closed on
Jan 8, 2016
Sold by
Anderson Jimmie E and Anderson Patricia
Bought by
Jackson Robert J and Jackson Gwendolyn L
Current Estimated Value
Home Financials for this Owner
Home Financials are based on the most recent Mortgage that was taken out on this home.
Original Mortgage
$180,000
Outstanding Balance
$142,869
Interest Rate
3.98%
Mortgage Type
VA
Estimated Equity
$73,702
Purchase Details
Closed on
Sep 25, 2013
Sold by
Coon Jeff L and Coon Elizabeth A
Bought by
Anderson Jimmie E and Anderson Patricia
Home Financials for this Owner
Home Financials are based on the most recent Mortgage that was taken out on this home.
Original Mortgage
$150,100
Interest Rate
4.46%
Mortgage Type
New Conventional
Purchase Details
Closed on
Oct 14, 2004
Sold by
Tejeda Juan and Tejeda Antonio
Purchase Details
Closed on
Sep 26, 2000
Sold by
Thomas James P
Purchase Details
Closed on
Oct 15, 1997
Sold by
Garner William Kenneth
Create a Home Valuation Report for This Property
The Home Valuation Report is an in-depth analysis detailing your home's value as well as a comparison with similar homes in the area
Home Values in the Area
Average Home Value in this Area
Purchase History
| Date | Buyer | Sale Price | Title Company |
|---|---|---|---|
| Jackson Robert J | $180,000 | None Available | |
| Anderson Jimmie E | $158,000 | None Available | |
| -- | $142,000 | -- | |
| -- | $135,000 | -- | |
| -- | $124,500 | -- |
Source: Public Records
Mortgage History
| Date | Status | Borrower | Loan Amount |
|---|---|---|---|
| Open | Jackson Robert J | $180,000 | |
| Previous Owner | Anderson Jimmie E | $150,100 |
Source: Public Records
Tax History Compared to Growth
Tax History
| Year | Tax Paid | Tax Assessment Tax Assessment Total Assessment is a certain percentage of the fair market value that is determined by local assessors to be the total taxable value of land and additions on the property. | Land | Improvement |
|---|---|---|---|---|
| 2025 | $1,919 | $22,302 | $3,309 | $18,993 |
| 2024 | $1,919 | $22,325 | $3,309 | $19,016 |
| 2023 | $1,919 | $21,078 | $3,309 | $17,769 |
| 2022 | $1,701 | $20,075 | $3,309 | $16,766 |
| 2021 | $1,683 | $19,704 | $3,309 | $16,395 |
| 2020 | $1,900 | $21,952 | $2,462 | $19,490 |
| 2019 | $1,899 | $21,766 | $2,462 | $19,304 |
| 2018 | $1,599 | $21,421 | $2,462 | $18,959 |
| 2017 | $1,599 | $21,421 | $2,462 | $18,959 |
| 2016 | $1,447 | $19,380 | $1,286 | $18,094 |
| 2015 | $1,447 | $19,380 | $1,286 | $18,094 |
| 2014 | $1,415 | $18,960 | $1,286 | $17,674 |
Source: Public Records
Map
Nearby Homes
- 701 Hayes St
- 700 Taft St
- 512 Horizon Dr
- 500 Horizon Dr
- 812 Village Dr
- 801 Rosehaven Dr
- 601 Sky Cir
- 1405 Rosehaven Dr
- 809 Canterbury Blvd
- 1004 Village Dr
- 701 N Park Ln
- 817 Windsor Dr
- 1329 E Spruce St
- 1017 E Cypress St
- 0 Lot 1 Red Bud Dr Unit 1152713
- 1016 E Cypress St
- 0 Redbud Ln Unit 1152710
- 1005 N Thomas St
- 913 E Sycamore Ave
- 900 E Elm St