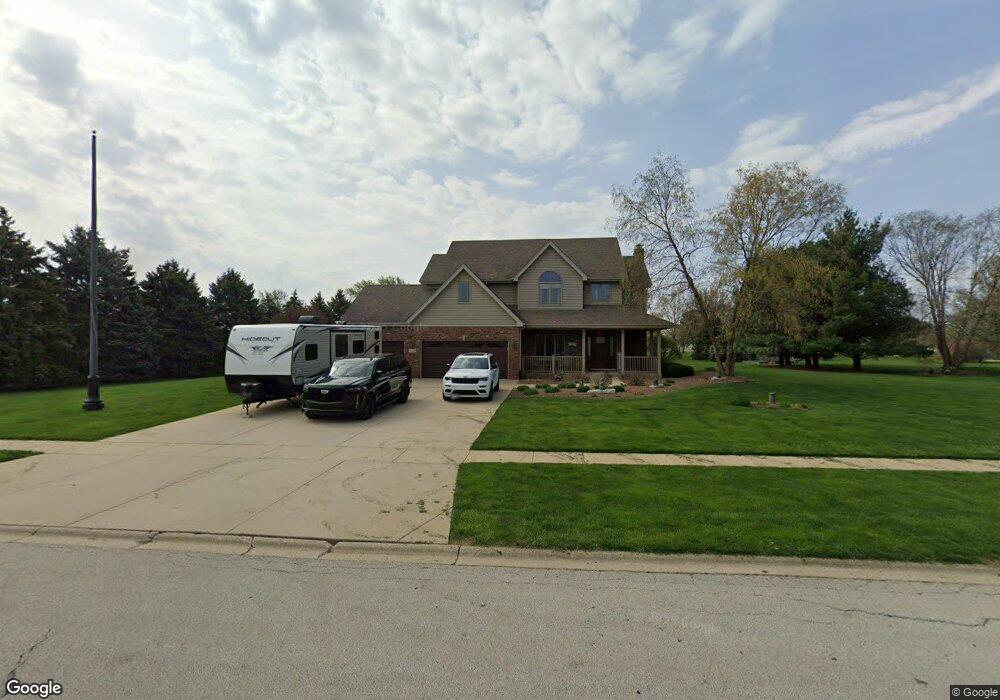
612 Hazelwood Dr New Lenox, IL 60451
Estimated Value: $488,906 - $596,000
--
Bed
--
Bath
--
Sq Ft
0.97
Acres
About This Home
This home is located at 612 Hazelwood Dr, New Lenox, IL 60451 and is currently estimated at $555,977. 612 Hazelwood Dr is a home located in Will County with nearby schools including Spencer Trail, Spencer Pointe, and Spencer Crossing Intermediate School.
Ownership History
Date
Name
Owned For
Owner Type
Purchase Details
Closed on
Apr 2, 2020
Sold by
Lowe James A and Lowe Kkathy M
Bought by
Delago Alexander J and Delago Michelle M
Current Estimated Value
Home Financials for this Owner
Home Financials are based on the most recent Mortgage that was taken out on this home.
Original Mortgage
$375,200
Outstanding Balance
$333,625
Interest Rate
3.6%
Mortgage Type
New Conventional
Estimated Equity
$222,352
Purchase Details
Closed on
Apr 19, 2002
Sold by
Daniel Construction Inc
Bought by
Lowe James A and Lowe Kathy M
Home Financials for this Owner
Home Financials are based on the most recent Mortgage that was taken out on this home.
Original Mortgage
$220,000
Interest Rate
7.13%
Purchase Details
Closed on
Aug 29, 2001
Sold by
Stellwagen David L and Stellwagen Linda
Bought by
Daniel Construction Inc
Create a Home Valuation Report for This Property
The Home Valuation Report is an in-depth analysis detailing your home's value as well as a comparison with similar homes in the area
Home Values in the Area
Average Home Value in this Area
Purchase History
| Date | Buyer | Sale Price | Title Company |
|---|---|---|---|
| Delago Alexander J | $395,000 | None Available | |
| Lowe James A | $300,000 | Chicago Title Insurance Co | |
| Daniel Construction Inc | $73,000 | Chicago Title Insurance Co |
Source: Public Records
Mortgage History
| Date | Status | Borrower | Loan Amount |
|---|---|---|---|
| Open | Delago Alexander J | $375,200 | |
| Previous Owner | Lowe James A | $220,000 |
Source: Public Records
Tax History Compared to Growth
Tax History
| Year | Tax Paid | Tax Assessment Tax Assessment Total Assessment is a certain percentage of the fair market value that is determined by local assessors to be the total taxable value of land and additions on the property. | Land | Improvement |
|---|---|---|---|---|
| 2024 | $11,402 | $153,720 | $38,125 | $115,595 |
| 2023 | $11,402 | $140,128 | $34,754 | $105,374 |
| 2022 | $10,267 | $129,091 | $32,017 | $97,074 |
| 2021 | $9,753 | $121,406 | $30,111 | $91,295 |
| 2020 | $9,475 | $117,075 | $29,037 | $88,038 |
| 2019 | $9,065 | $113,445 | $28,137 | $85,308 |
| 2018 | $8,856 | $109,534 | $27,167 | $82,367 |
| 2017 | $8,407 | $106,385 | $26,386 | $79,999 |
| 2016 | $8,161 | $103,538 | $25,680 | $77,858 |
| 2015 | $7,905 | $100,279 | $24,872 | $75,407 |
| 2014 | $7,905 | $99,041 | $24,565 | $74,476 |
| 2013 | $7,905 | $100,376 | $24,896 | $75,480 |
Source: Public Records
Map
Nearby Homes
- LOT 8 W Laraway Rd
- 1990 Edgeview Dr
- 1981 Stapleton Rd
- 13255 W Laraway Rd
- 2067 Edgeview Dr
- 575 Caledonia Dr
- 1000 S Cedar Rd
- 2185 Bristol Park Rd
- Raleigh Plan at Calistoga
- Siena II Plan at Calistoga
- Galveston Plan at Calistoga
- Brooklyn Plan at Calistoga
- Ontario Plan at Calistoga
- Westbury Plan at Calistoga
- 2231 Stone Creek Dr
- 2241 Stone Creek Dr
- 2251 Stone Creek Dr
- 2291 Stone Creek Dr
- 2301 Stone Creek Dr
- 920 Barnside Rd
- 608 Hazelwood Dr
- 614 Hazelwood Dr
- 1700 Hermitage Dr
- 613 Hazelwood Dr
- 1619 Bellechase Dr
- 1512 Hermitage Dr
- 615 Hazelwood Dr Unit 1
- 1609 Hermitage Dr Unit 2
- 1605 Hermitage Dr
- 1701 Bellechase Dr
- 1704 Hermitage Dr
- 1508 Hermitage Dr
- 1719 Bellechase Dr
- 1600 Bellechase Dr
- 1613 Hermitage Dr
- 1620 Bellechase Dr
- 1701 Hermitage Dr
- 1601 Hermitage Dr
- 1539 Bellechase Dr
- 1640 Bellechase Dr