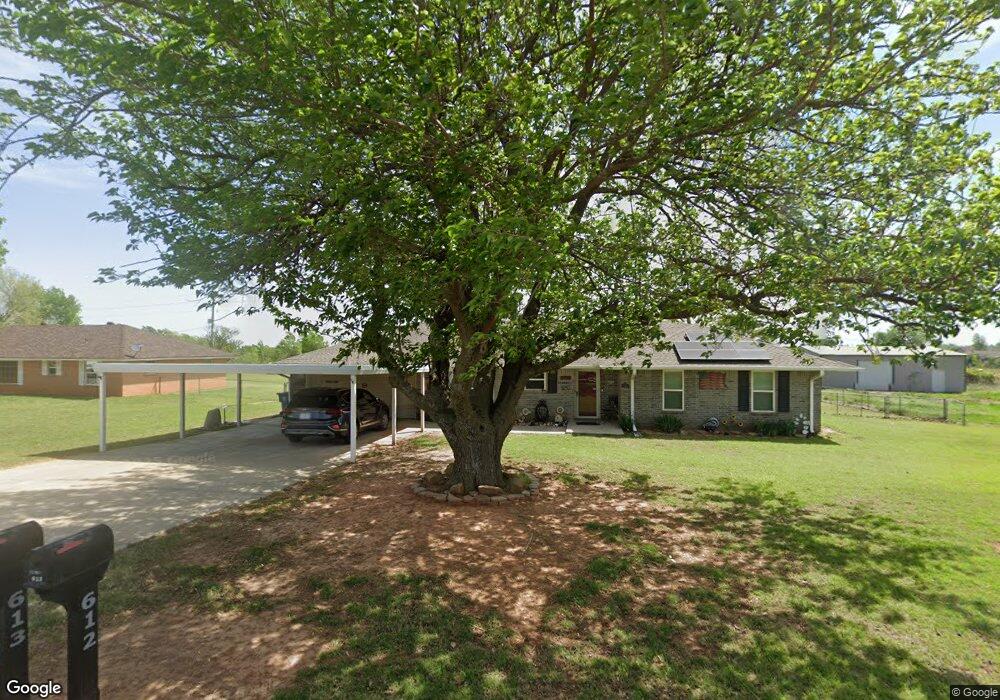
612 Meadow Ln Tuttle, OK 73089
Estimated Value: $204,566 - $259,000
3
Beds
2
Baths
1,380
Sq Ft
$171/Sq Ft
Est. Value
About This Home
This home is located at 612 Meadow Ln, Tuttle, OK 73089 and is currently estimated at $235,892, approximately $170 per square foot. 612 Meadow Ln is a home located in Grady County with nearby schools including Tuttle Elementary School, Tuttle Intermediate School, and Tuttle Middle School.
Ownership History
Date
Name
Owned For
Owner Type
Purchase Details
Closed on
Nov 30, 2012
Sold by
Jones Cheyanne E and Jones Landon
Bought by
Allred Vernon G and Allred Nicolette
Current Estimated Value
Home Financials for this Owner
Home Financials are based on the most recent Mortgage that was taken out on this home.
Original Mortgage
$120,000
Outstanding Balance
$83,001
Interest Rate
3.41%
Mortgage Type
VA
Estimated Equity
$152,891
Purchase Details
Closed on
Feb 7, 2007
Sold by
Johnson James E
Bought by
Jones Cheyanne E and Jones Landon
Home Financials for this Owner
Home Financials are based on the most recent Mortgage that was taken out on this home.
Original Mortgage
$105,306
Interest Rate
6.17%
Mortgage Type
FHA
Purchase Details
Closed on
Jul 30, 2004
Sold by
Scroggins Carlus Leymoin
Bought by
Johnson James E
Create a Home Valuation Report for This Property
The Home Valuation Report is an in-depth analysis detailing your home's value as well as a comparison with similar homes in the area
Home Values in the Area
Average Home Value in this Area
Purchase History
| Date | Buyer | Sale Price | Title Company |
|---|---|---|---|
| Allred Vernon G | $120,000 | The Oklahoma City Abstract & | |
| Jones Cheyanne E | $107,000 | None Available | |
| Johnson James E | $96,000 | -- |
Source: Public Records
Mortgage History
| Date | Status | Borrower | Loan Amount |
|---|---|---|---|
| Open | Allred Vernon G | $120,000 | |
| Previous Owner | Jones Cheyanne E | $105,306 |
Source: Public Records
Tax History
| Year | Tax Paid | Tax Assessment Tax Assessment Total Assessment is a certain percentage of the fair market value that is determined by local assessors to be the total taxable value of land and additions on the property. | Land | Improvement |
|---|---|---|---|---|
| 2025 | -- | $14,874 | $1,897 | $12,977 |
| 2024 | -- | $14,441 | $1,842 | $12,599 |
| 2023 | $1,473 | $14,020 | $2,071 | $11,949 |
| 2022 | $1,473 | $13,353 | $1,583 | $11,770 |
| 2021 | $1,605 | $13,683 | $1,583 | $12,100 |
| 2020 | $1,525 | $13,926 | $1,583 | $12,343 |
| 2019 | $1,452 | $14,256 | $1,583 | $12,673 |
| 2018 | $1,268 | $13,261 | $1,583 | $11,678 |
| 2017 | $1,301 | $13,262 | $1,583 | $11,679 |
| 2016 | $1,358 | $13,571 | $1,583 | $11,988 |
| 2015 | $1,278 | $13,747 | $1,583 | $12,164 |
| 2014 | $1,278 | $13,475 | $1,430 | $12,045 |
Source: Public Records
Map
Nearby Homes
- 6905 Rolling Meadows
- 221 Heather Ln
- 6910 Rolling Meadows
- 300 Wildwood Dr
- 407 Burntwood Dr
- 614 Cinderwood Ct
- 921 Hannah Dr
- 2401 County Road 1196
- 301 W Ponderosa Dr
- 1121 Whispering Meadows Ln
- 5 Loblolly Ln
- 745 Luna Way
- 737 Luna Way
- 752 Luna Way
- 728 Luna Way
- 733 Luna Way
- 717 Luna Way
- 741 Luna Way
- 5314 Kye Dr
- 4852 Montie Cir
Your Personal Tour Guide
Ask me questions while you tour the home.