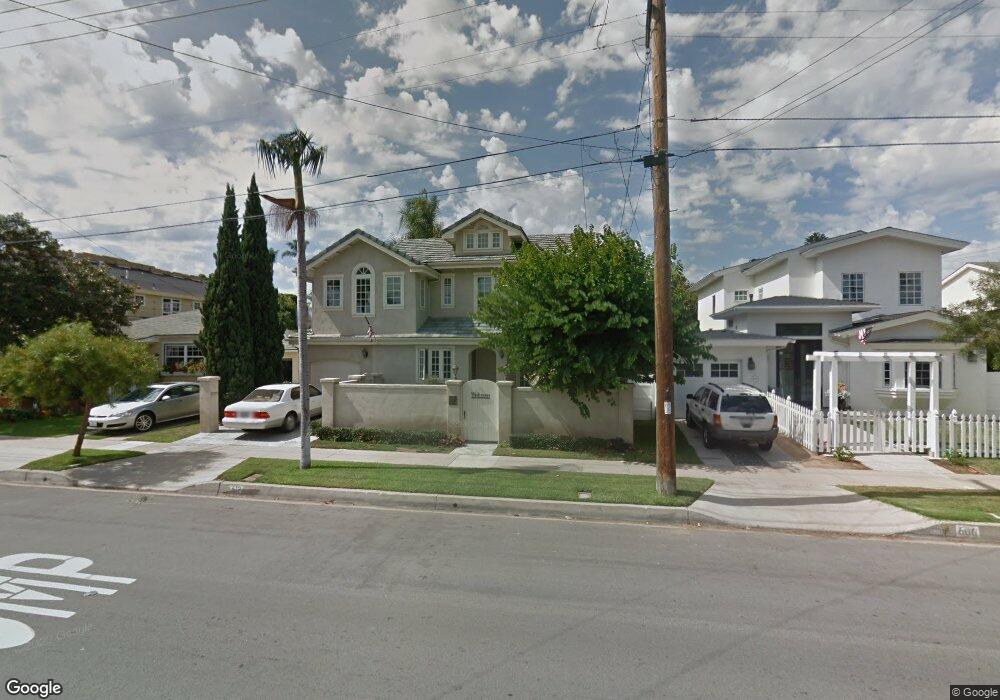
612 Pomona Ave Coronado, CA 92118
Estimated Value: $2,677,000 - $4,841,000
3
Beds
4
Baths
3,141
Sq Ft
$1,271/Sq Ft
Est. Value
About This Home
This home is located at 612 Pomona Ave, Coronado, CA 92118 and is currently estimated at $3,990,752, approximately $1,270 per square foot. 612 Pomona Ave is a home located in San Diego County with nearby schools including Coronado Village Elementary, Coronado Middle School, and Coronado High School.
Ownership History
Date
Name
Owned For
Owner Type
Purchase Details
Closed on
Sep 27, 2006
Sold by
Marion Kenneth T and Marion Linda K
Bought by
Marion Kenneth T and Marion Linda K
Current Estimated Value
Purchase Details
Closed on
Jan 24, 1994
Sold by
Norconk James Joseph and Norconk Kathleen J
Bought by
Marion Kenneth T and Marion Linda K
Home Financials for this Owner
Home Financials are based on the most recent Mortgage that was taken out on this home.
Original Mortgage
$297,600
Interest Rate
7.15%
Create a Home Valuation Report for This Property
The Home Valuation Report is an in-depth analysis detailing your home's value as well as a comparison with similar homes in the area
Home Values in the Area
Average Home Value in this Area
Purchase History
| Date | Buyer | Sale Price | Title Company |
|---|---|---|---|
| Marion Kenneth T | -- | None Available | |
| Marion Kenneth T | $372,000 | Fidelity National Title |
Source: Public Records
Mortgage History
| Date | Status | Borrower | Loan Amount |
|---|---|---|---|
| Previous Owner | Marion Kenneth T | $297,600 |
Source: Public Records
Tax History Compared to Growth
Tax History
| Year | Tax Paid | Tax Assessment Tax Assessment Total Assessment is a certain percentage of the fair market value that is determined by local assessors to be the total taxable value of land and additions on the property. | Land | Improvement |
|---|---|---|---|---|
| 2025 | $8,927 | $812,647 | $358,464 | $454,183 |
| 2024 | $8,927 | $796,714 | $351,436 | $445,278 |
| 2023 | $8,789 | $781,094 | $344,546 | $436,548 |
| 2022 | $8,627 | $765,780 | $337,791 | $427,989 |
| 2021 | $8,504 | $750,766 | $331,168 | $419,598 |
| 2020 | $8,275 | $743,069 | $327,773 | $415,296 |
| 2019 | $8,262 | $728,500 | $321,347 | $407,153 |
| 2018 | $8,185 | $714,217 | $315,047 | $399,170 |
| 2017 | $8,019 | $700,214 | $308,870 | $391,344 |
| 2016 | $7,685 | $686,485 | $302,814 | $383,671 |
| 2015 | $7,544 | $676,174 | $298,266 | $377,908 |
| 2014 | $7,341 | $662,930 | $292,424 | $370,506 |
Source: Public Records
Map
Nearby Homes