612 Quail Ct Unit 18 Good Hope, GA 30641
Estimated Value: $461,201 - $518,000
--
Bed
--
Bath
2,201
Sq Ft
$221/Sq Ft
Est. Value
About This Home
This home is located at 612 Quail Ct Unit 18, Good Hope, GA 30641 and is currently estimated at $486,550, approximately $221 per square foot. 612 Quail Ct Unit 18 is a home located in Walton County with nearby schools including Harmony Elementary School, Carver Middle School, and Monroe Area High School.
Ownership History
Date
Name
Owned For
Owner Type
Purchase Details
Closed on
Sep 13, 2021
Sold by
Johnson Clifton Anthony
Bought by
Colon Juan B and Colon Shannon N
Current Estimated Value
Purchase Details
Closed on
Oct 5, 2018
Sold by
Cole Fallon D
Bought by
Cole Fallon D and Johnson Clifton Anthony
Home Financials for this Owner
Home Financials are based on the most recent Mortgage that was taken out on this home.
Original Mortgage
$216,015
Interest Rate
4.5%
Mortgage Type
FHA
Purchase Details
Closed on
Mar 15, 2018
Sold by
Matt I Thompson I
Bought by
Saint Ives Builders Grp Llc
Home Financials for this Owner
Home Financials are based on the most recent Mortgage that was taken out on this home.
Original Mortgage
$189,750
Interest Rate
4.38%
Mortgage Type
New Conventional
Create a Home Valuation Report for This Property
The Home Valuation Report is an in-depth analysis detailing your home's value as well as a comparison with similar homes in the area
Home Values in the Area
Average Home Value in this Area
Purchase History
| Date | Buyer | Sale Price | Title Company |
|---|---|---|---|
| Colon Juan B | $374,900 | -- | |
| Cole Fallon D | -- | -- | |
| Cole Fallon D | $220,000 | -- | |
| Saint Ives Builders Grp Llc | $22,500 | -- |
Source: Public Records
Mortgage History
| Date | Status | Borrower | Loan Amount |
|---|---|---|---|
| Previous Owner | Cole Fallon D | $216,015 | |
| Previous Owner | Saint Ives Builders Grp Llc | $189,750 |
Source: Public Records
Tax History Compared to Growth
Tax History
| Year | Tax Paid | Tax Assessment Tax Assessment Total Assessment is a certain percentage of the fair market value that is determined by local assessors to be the total taxable value of land and additions on the property. | Land | Improvement |
|---|---|---|---|---|
| 2024 | $4,419 | $184,480 | $28,800 | $155,680 |
| 2023 | $4,569 | $182,920 | $27,200 | $155,720 |
| 2022 | $4,131 | $147,040 | $22,400 | $124,640 |
| 2021 | $3,306 | $104,840 | $11,400 | $93,440 |
| 2020 | $3,310 | $101,120 | $11,400 | $89,720 |
| 2019 | $2,880 | $8,880 | $8,880 | $0 |
| 2018 | $347 | $8,880 | $8,880 | $0 |
| 2017 | $294 | $8,520 | $8,520 | $0 |
| 2016 | $251 | $5,920 | $5,920 | $0 |
| 2015 | $167 | $3,400 | $3,400 | $0 |
| 2014 | $170 | $3,400 | $0 | $0 |
Source: Public Records
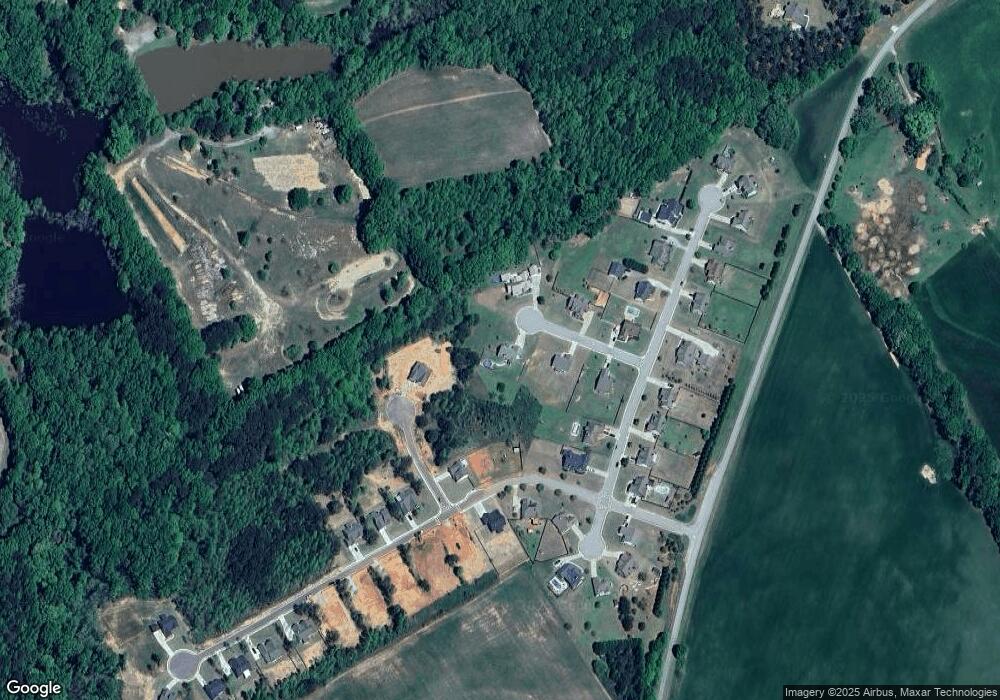
Map
Nearby Homes
- 209 Squirrel Run
- 205 Squirrel Run
- 240 Good Hope Preserve
- 222 Good Hope Preserve
- 224 Good Hope Preserve
- 226 Good Hope Preserve
- 230 Good Hope Preserve
- 429 Rabbit Run
- 3061 Marion Ivie Rd
- 0 Queens Cemetery Rd Unit 7640672
- 0 Queens Cemetery Rd Unit 10593824
- 246 Queens Cemetery Rd
- 3050 Marion Ivie Rd
- 1560 J M Brown Rd
- 57 Tomahawk Trail
- 93 Tomahawk Trail
- 612 Quail Ct
- 608 Quail Ct Unit 19
- 608 Quail Ct
- 604 Quail Ct Unit 20
- 604 Quail Ct
- 609 Quail Ct
- 605 Quail Ct
- 0 Quail Ct Unit 7212760
- 0 Quail Ct Unit 3226705
- 0 Quail Ct Unit 8491140
- 0 Quail Ct Unit 8204266
- 0 Quail Ct Unit 7618476
- 0 Quail Ct Unit 8841893
- 0 Quail Ct
- 600 Quail Ct
- 420 Rabbit Run
- 601 Quail Ct
- 416 Rabbit Run
- 412 Rabbit Run
- 432 Rabbit Run