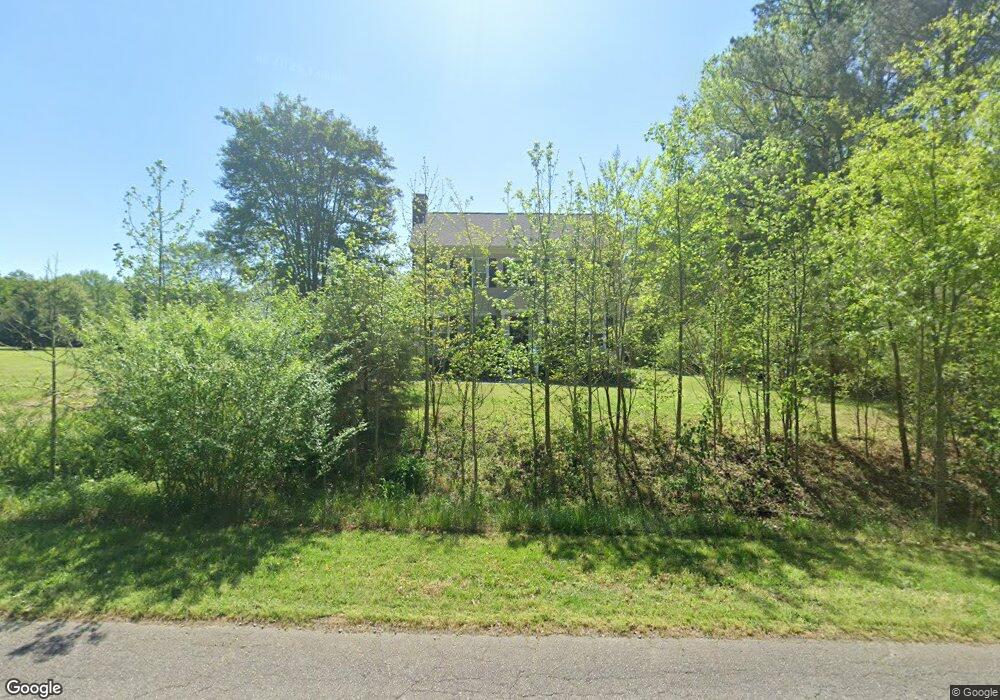
612 S Meadow Rd Raleigh, NC 27603
Estimated Value: $346,000 - $362,000
3
Beds
3
Baths
1,548
Sq Ft
$230/Sq Ft
Est. Value
About This Home
This home is located at 612 S Meadow Rd, Raleigh, NC 27603 and is currently estimated at $355,380, approximately $229 per square foot. 612 S Meadow Rd is a home located in Wake County with nearby schools including Rand Road Elementary, North Garner Middle, and South Garner High.
Ownership History
Date
Name
Owned For
Owner Type
Purchase Details
Closed on
Mar 1, 2017
Sold by
Schultze Melissa
Bought by
Luzader Jordan and Luzader Meghan
Current Estimated Value
Home Financials for this Owner
Home Financials are based on the most recent Mortgage that was taken out on this home.
Original Mortgage
$146,000
Outstanding Balance
$120,801
Interest Rate
4.09%
Mortgage Type
New Conventional
Estimated Equity
$234,579
Purchase Details
Closed on
Sep 30, 2013
Sold by
Metty Kirk and Metty Kellee
Bought by
Schultze Melissa
Home Financials for this Owner
Home Financials are based on the most recent Mortgage that was taken out on this home.
Original Mortgage
$135,500
Interest Rate
4.25%
Mortgage Type
FHA
Purchase Details
Closed on
Dec 16, 2004
Sold by
Green Ricky W and Green Bettina H
Bought by
Metty Karl and Metty Kellee
Create a Home Valuation Report for This Property
The Home Valuation Report is an in-depth analysis detailing your home's value as well as a comparison with similar homes in the area
Home Values in the Area
Average Home Value in this Area
Purchase History
| Date | Buyer | Sale Price | Title Company |
|---|---|---|---|
| Luzader Jordan | $182,500 | None Available | |
| Schultze Melissa | $142,000 | None Available | |
| Metty Karl | -- | -- |
Source: Public Records
Mortgage History
| Date | Status | Borrower | Loan Amount |
|---|---|---|---|
| Open | Luzader Jordan | $146,000 | |
| Previous Owner | Schultze Melissa | $135,500 |
Source: Public Records
Tax History Compared to Growth
Tax History
| Year | Tax Paid | Tax Assessment Tax Assessment Total Assessment is a certain percentage of the fair market value that is determined by local assessors to be the total taxable value of land and additions on the property. | Land | Improvement |
|---|---|---|---|---|
| 2025 | $2,110 | $326,739 | $100,000 | $226,739 |
| 2024 | $2,049 | $326,739 | $100,000 | $226,739 |
| 2023 | $1,594 | $201,930 | $52,000 | $149,930 |
| 2022 | $1,478 | $201,930 | $52,000 | $149,930 |
| 2021 | $1,439 | $201,930 | $52,000 | $149,930 |
| 2020 | $1,415 | $201,930 | $52,000 | $149,930 |
| 2019 | $1,276 | $153,849 | $40,000 | $113,849 |
| 2018 | $1,174 | $153,849 | $40,000 | $113,849 |
| 2017 | $1,114 | $153,849 | $40,000 | $113,849 |
| 2016 | $1,092 | $153,849 | $40,000 | $113,849 |
| 2015 | $1,052 | $148,601 | $40,000 | $108,601 |
| 2014 | $998 | $148,601 | $40,000 | $108,601 |
Source: Public Records
Map
Nearby Homes
- 1101 Robinfield Dr
- 1009 Feldmen Dr
- 6009 Swales Way
- 5013 Contender Dr
- 449 Kings Hollow Dr
- 1559 Upchurch Woods Dr
- 10001 Joe Leach Rd
- 6121 Catandpolly Ln
- 1021 Wintu Ct
- 6109 Oak Passage Dr
- 1005 Turner Meadow Dr
- 9017 Hunterfox Ct
- 6257 Oak Passage Dr
- 1017 Azalea Garden Cir
- 1004 Snow Peak Ct
- 6501 Rock Service Station Rd
- 1025 Azalea Garden Cir
- 1033 Azalea Garden Cir
- 1220 Turner Woods Dr
- 1037 Azalea Garden Cir
- 9304 Meadow Rue Place
- 608 S Meadow Rd
- 9312 Meadow Rue Place
- 9212 Tree Meadow Ln
- 9209 Tree Meadow Ln
- 5605 Meadow Rue Place
- 600 S Meadow Rd
- 9305 Meadow Rue Place
- 9301 Meadow Rue Place
- 9317 Meadow Rue Place
- 605 S Meadow Rd
- 705 S Meadow Rd
- 9313 Meadow Rue Place
- 9208 Tree Meadow Ln
- 601 S Meadow Rd
- 9309 Meadow Rue Place
- 9204 Tree Meadow Ln
- 9201 Tree Meadow Ln
- 9200 Tree Meadow Ln
- 709 S Meadow Rd