Estimated Value: $264,000 - $328,000
3
Beds
3
Baths
1,776
Sq Ft
$160/Sq Ft
Est. Value
About This Home
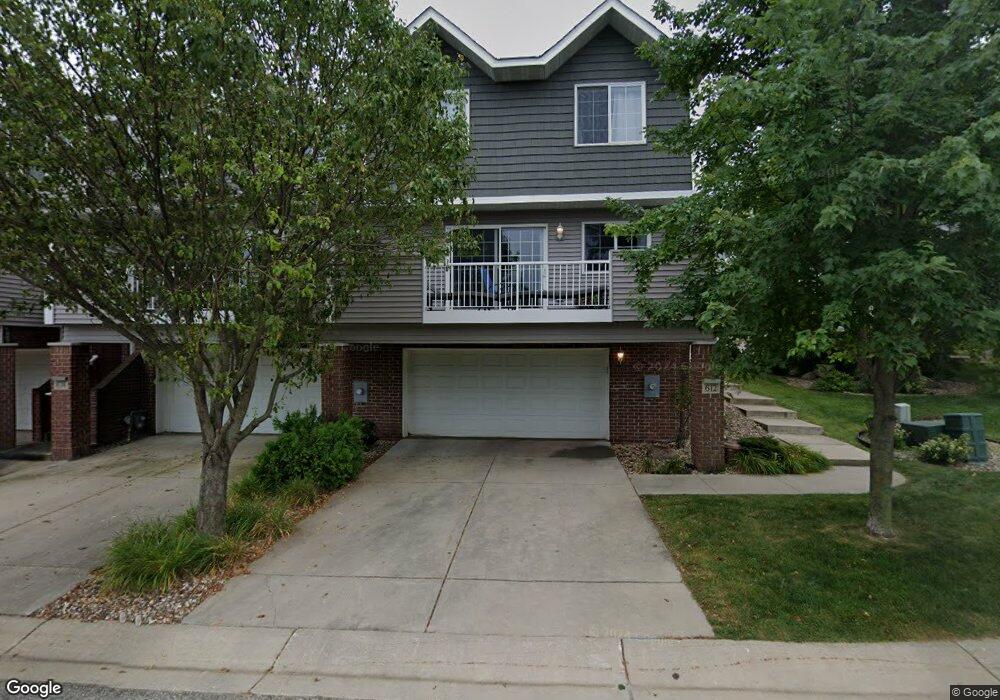
This home is located at 612 Shardlow Ln NE, Byron, MN 55920 and is currently estimated at $283,551, approximately $159 per square foot. 612 Shardlow Ln NE is a home located in Olmsted County with nearby schools including Byron Intermediate School, Byron Middle School, and Byron Senior High School.
Ownership History
Date
Name
Owned For
Owner Type
Purchase Details
Closed on
Oct 2, 2012
Sold by
Dixon Stephen and Dixon Adrene
Bought by
Kamilaw Peter
Current Estimated Value
Home Financials for this Owner
Home Financials are based on the most recent Mortgage that was taken out on this home.
Original Mortgage
$136,800
Outstanding Balance
$94,997
Interest Rate
3.57%
Mortgage Type
New Conventional
Estimated Equity
$188,554
Purchase Details
Closed on
Dec 15, 2010
Sold by
Brewer Peter E and Brewer Beverly A
Bought by
Dixon Stephen and Dixon Adrene
Home Financials for this Owner
Home Financials are based on the most recent Mortgage that was taken out on this home.
Original Mortgage
$116,000
Interest Rate
4.22%
Mortgage Type
Credit Line Revolving
Purchase Details
Closed on
Nov 11, 2005
Sold by
Wensmann Homes Of Rochester Inc
Bought by
Brewer Peter E
Home Financials for this Owner
Home Financials are based on the most recent Mortgage that was taken out on this home.
Original Mortgage
$144,089
Interest Rate
6.17%
Mortgage Type
New Conventional
Create a Home Valuation Report for This Property
The Home Valuation Report is an in-depth analysis detailing your home's value as well as a comparison with similar homes in the area
Home Values in the Area
Average Home Value in this Area
Purchase History
| Date | Buyer | Sale Price | Title Company |
|---|---|---|---|
| Kamilaw Peter | $144,000 | Rochester Title & Escrow | |
| Dixon Stephen | $145,000 | Rochester Title & Escrow Co | |
| Brewer Peter E | $180,112 | Rhs Title Llc |
Source: Public Records
Mortgage History
| Date | Status | Borrower | Loan Amount |
|---|---|---|---|
| Open | Kamilaw Peter | $136,800 | |
| Previous Owner | Dixon Stephen | $116,000 | |
| Previous Owner | Brewer Peter E | $144,089 |
Source: Public Records
Tax History Compared to Growth
Tax History
| Year | Tax Paid | Tax Assessment Tax Assessment Total Assessment is a certain percentage of the fair market value that is determined by local assessors to be the total taxable value of land and additions on the property. | Land | Improvement |
|---|---|---|---|---|
| 2024 | $3,166 | $220,100 | $17,500 | $202,600 |
| 2023 | $3,356 | $227,700 | $17,500 | $210,200 |
| 2022 | $3,152 | $217,600 | $17,500 | $200,100 |
| 2021 | $2,820 | $190,100 | $17,500 | $172,600 |
| 2020 | $2,872 | $182,400 | $17,500 | $164,900 |
| 2019 | $2,658 | $181,300 | $17,500 | $163,800 |
| 2018 | $2,395 | $170,400 | $17,500 | $152,900 |
| 2017 | $2,366 | $155,900 | $12,500 | $143,400 |
| 2016 | $2,352 | $132,700 | $10,600 | $122,100 |
| 2015 | $2,294 | $128,800 | $10,600 | $118,200 |
| 2014 | $2,068 | $130,500 | $10,600 | $119,900 |
| 2012 | -- | $126,600 | $10,529 | $116,071 |
Source: Public Records
Map
Nearby Homes
- 1004 Southwell Enclave NE
- 700 Shardlow Place NE
- 1052 Southwell Enclave NE
- 702 Shardlow Place NE
- 1064 Southwell Enclave NE
- 1021 Southwell Enclave NE
- 1033 Southwell Enclave NE
- 1051 Southwell Enclave NE
- 959 Southwell Enclave NE
- 963 Southwell Enclave NE
- 720 Somerby Pkwy NE
- 667 Somerby Pkwy NE
- 655 Somerby Pkwy NE
- 675 Somerby Pkwy NE
- 785 Somerby Pkwy NE
- 813 Bridgeford Place NE
- 817 Bridgeford Place NE
- 843 Bridgeford Place NE
- 863 Bridgeford Place NE
- 919 Somerby Pkwy NE
- 612 Shardlow Place NE
- 612 Shardlow Ln NE
- 614 Shardlow Ln NE
- 673 Shardlow Place NE
- 675 Shardlow Place NE
- 616 Shardlow Ln NE
- 677 Shardlow Place NE
- 610 Shardlow Place NE
- 610 Shardlow Ln NE
- 618 Shardlow Ln NE
- 679 Shardlow Place NE
- 671 Shardlow Place NE
- 608 Shardlow Ln NE
- 620 Shardlow Ln NE
- TBD Shardlow Place NE
- 681 Shardlow Place NE
- 669 Shardlow Place NE
- 606 Shardlow Ln NE
- 622 Shardlow Ln NE
- 667 Shardlow Place NE