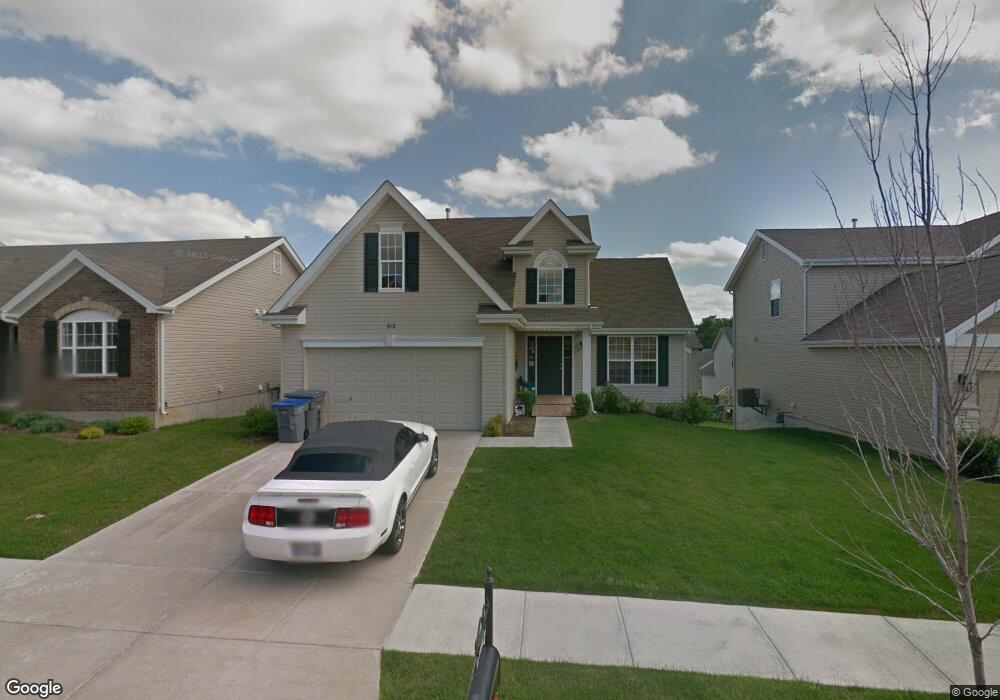
612 Spring Manor Unit 145C O Fallon, MO 63368
Estimated Value: $357,000 - $459,000
3
Beds
3
Baths
1,648
Sq Ft
$249/Sq Ft
Est. Value
About This Home
This home is located at 612 Spring Manor Unit 145C, O Fallon, MO 63368 and is currently estimated at $410,439, approximately $249 per square foot. 612 Spring Manor Unit 145C is a home located in St. Charles County with nearby schools including Prairie View Elementary School, Frontier Middle School, and Liberty High School.
Ownership History
Date
Name
Owned For
Owner Type
Purchase Details
Closed on
Sep 29, 2017
Sold by
Johnson Karen L
Bought by
Johnson Karen L and Divinny Johnson Dawn Marie
Current Estimated Value
Home Financials for this Owner
Home Financials are based on the most recent Mortgage that was taken out on this home.
Original Mortgage
$140,000
Outstanding Balance
$117,065
Interest Rate
3.86%
Mortgage Type
New Conventional
Estimated Equity
$293,374
Purchase Details
Closed on
Jun 21, 2012
Sold by
Mcbride Springhurst Llc
Bought by
Cross Ilura J and Cross Ralph R
Home Financials for this Owner
Home Financials are based on the most recent Mortgage that was taken out on this home.
Original Mortgage
$113,720
Interest Rate
3.83%
Mortgage Type
New Conventional
Create a Home Valuation Report for This Property
The Home Valuation Report is an in-depth analysis detailing your home's value as well as a comparison with similar homes in the area
Home Values in the Area
Average Home Value in this Area
Purchase History
| Date | Buyer | Sale Price | Title Company |
|---|---|---|---|
| Johnson Karen L | -- | Stellar Title Agency | |
| Cross Ilura J | $173,720 | Dependable Title Llc |
Source: Public Records
Mortgage History
| Date | Status | Borrower | Loan Amount |
|---|---|---|---|
| Open | Johnson Karen L | $140,000 | |
| Previous Owner | Cross Ilura J | $113,720 |
Source: Public Records
Tax History Compared to Growth
Tax History
| Year | Tax Paid | Tax Assessment Tax Assessment Total Assessment is a certain percentage of the fair market value that is determined by local assessors to be the total taxable value of land and additions on the property. | Land | Improvement |
|---|---|---|---|---|
| 2025 | $4,473 | $72,941 | -- | -- |
| 2023 | $4,477 | $65,361 | $0 | $0 |
| 2022 | $3,857 | $52,451 | $0 | $0 |
| 2021 | $3,865 | $52,451 | $0 | $0 |
| 2020 | $3,647 | $47,554 | $0 | $0 |
| 2019 | $3,423 | $47,554 | $0 | $0 |
| 2018 | $3,401 | $44,963 | $0 | $0 |
| 2017 | $3,376 | $44,963 | $0 | $0 |
| 2016 | $3,136 | $40,058 | $0 | $0 |
| 2015 | $3,089 | $40,058 | $0 | $0 |
| 2014 | $2,326 | $32,347 | $0 | $0 |
Source: Public Records
Map
Nearby Homes
- 447 Wild Oak Dr
- 6103 Spring Creek Ln
- 5302 Spring Creek Ln
- 8302 Spring Creek Ln
- 7100 Spring Creek Ln
- 9100 Spring Creek Ln
- 66 Sorrel Dr
- 131 Cardow Dr
- 355 Newbridge Way
- 134 Pinto Cir
- 141 Cardow Dr
- 191 Noahs Mill Dr
- 210 Newal Way
- 1 Princeton @ Creekside Sommers
- 80 Mora Blvd
- 80 Mora Blvd Unit 436-402
- 2570 Technology Dr
- 1 Canterbury @ Creekside Sommers
- 103 Cardow Dr Unit 169-605
- 109 Sommers Creek Ct
- 612 Spring Manor
- 610 Spring Manor
- 610 Spring Manor Unit 146C
- 614 Spring Manor
- 608 Spring Manor
- 705 English Ivy
- 707 English Ivy
- 616 Spring Manor
- 709 English
- 703 English Ivy
- 709Lot 140C English Ivy
- 615 Spring Manor
- 609 Spring Manor
- 607 Spring Manor
- 711 English Ivy
- 617 Spring Manor
- 617 Spring Manor Unit 66
- 701 English Ivy
- 605 Spring Manor
- 713 English Ivy