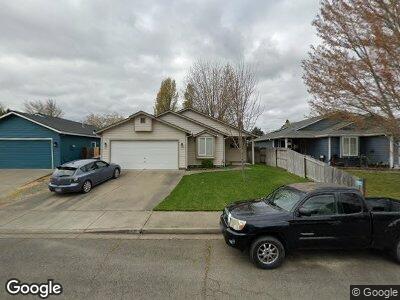
612 SW Larch Rd Grants Pass, OR 97526
Estimated Value: $311,335 - $329,000
3
Beds
2
Baths
1,320
Sq Ft
$243/Sq Ft
Est. Value
About This Home
This home is located at 612 SW Larch Rd, Grants Pass, OR 97526 and is currently estimated at $320,168, approximately $242 per square foot. 612 SW Larch Rd is a home located in Josephine County with nearby schools including Ft. Vannoy Elementary School, Fleming Middle School, and North Valley High School.
Ownership History
Date
Name
Owned For
Owner Type
Purchase Details
Closed on
Sep 4, 2014
Sold by
Schlalheim Mark L and Schallheim Floydell M
Bought by
Schallheim Trust
Current Estimated Value
Home Financials for this Owner
Home Financials are based on the most recent Mortgage that was taken out on this home.
Original Mortgage
$121,875
Interest Rate
4.12%
Mortgage Type
New Conventional
Purchase Details
Closed on
Aug 20, 2014
Sold by
Morrow Timothy R
Bought by
Schallheim Mark L and Schallheim Floydell M
Home Financials for this Owner
Home Financials are based on the most recent Mortgage that was taken out on this home.
Original Mortgage
$121,875
Interest Rate
4.12%
Mortgage Type
New Conventional
Purchase Details
Closed on
Nov 3, 2010
Sold by
Morrow Timothy R and Morrow Robert E
Bought by
Morrow Timothy R
Home Financials for this Owner
Home Financials are based on the most recent Mortgage that was taken out on this home.
Original Mortgage
$77,500
Interest Rate
4.27%
Mortgage Type
New Conventional
Create a Home Valuation Report for This Property
The Home Valuation Report is an in-depth analysis detailing your home's value as well as a comparison with similar homes in the area
Home Values in the Area
Average Home Value in this Area
Purchase History
| Date | Buyer | Sale Price | Title Company |
|---|---|---|---|
| Schallheim Trust | -- | Ticor Title Company | |
| Schallheim Mark L | $162,500 | Ticor Title Company | |
| Morrow Timothy R | -- | First American |
Source: Public Records
Mortgage History
| Date | Status | Borrower | Loan Amount |
|---|---|---|---|
| Open | Schallheim Trust | $110,000 | |
| Closed | Schallheim Mark L | $121,875 | |
| Previous Owner | Morrow Timothy R | $77,500 |
Source: Public Records
Tax History Compared to Growth
Tax History
| Year | Tax Paid | Tax Assessment Tax Assessment Total Assessment is a certain percentage of the fair market value that is determined by local assessors to be the total taxable value of land and additions on the property. | Land | Improvement |
|---|---|---|---|---|
| 2024 | $2,214 | $176,070 | -- | -- |
| 2023 | $2,086 | $170,950 | $0 | $0 |
| 2022 | $2,096 | $165,980 | -- | -- |
| 2021 | $1,969 | $161,150 | $0 | $0 |
| 2020 | $1,983 | $156,460 | $0 | $0 |
| 2019 | $1,913 | $151,910 | $0 | $0 |
| 2018 | $1,961 | $147,490 | $0 | $0 |
| 2017 | $1,955 | $143,200 | $0 | $0 |
| 2016 | $1,716 | $139,030 | $0 | $0 |
| 2015 | $1,661 | $134,990 | $0 | $0 |
| 2014 | $1,616 | $131,060 | $0 | $0 |
Source: Public Records
Map
Nearby Homes
- 617 SW Larch Rd
- 647 SW Larch Rd
- 2225 SW Judy Ln
- 600 Roguelea Ln
- 112 Wedgewood Dr
- 750 Roguelea Ln
- 705 Lincoln Rd
- 914 Schaefers Ln
- 127 Brentwood Dr
- 1990 SW Betty Ln
- 747 Hampton Way
- 882 Roguelea Ln
- 783 Hampton Way
- 753 SW Kinsington Ct
- 336 Winston Dr
- 1950 SW Betty Ln
- 313 Winston Dr
- 780 Kings Way
- 325 Winston Dr
- 858 Roguelea Ln
- 612 SW Larch Rd
- 606 SW Larch Rd
- 618 SW Larch Rd
- 600 SW Larch Rd
- 624 SW Larch Rd
- 2241 SW Judy Ln
- 630 SW Larch Rd
- 592/594 SW Larch Rd
- 592 SW Larch Rd
- 623 SW Larch Rd
- 2231 SW Judy Ln
- 636 SW Larch Rd
- 629 SW Larch Rd
- 2240 SW Judy Ln
- 2192 Chambers Ln
- 642 SW Larch Rd
- 2232 SW Judy Ln
- 635 SW Larch Rd
- 2198 Chambers Ln
- 2219 SW Judy Ln