612 W 18th St Ashland, OH 44805
Estimated Value: $136,000 - $169,000
2
Beds
1
Bath
832
Sq Ft
$177/Sq Ft
Est. Value
About This Home
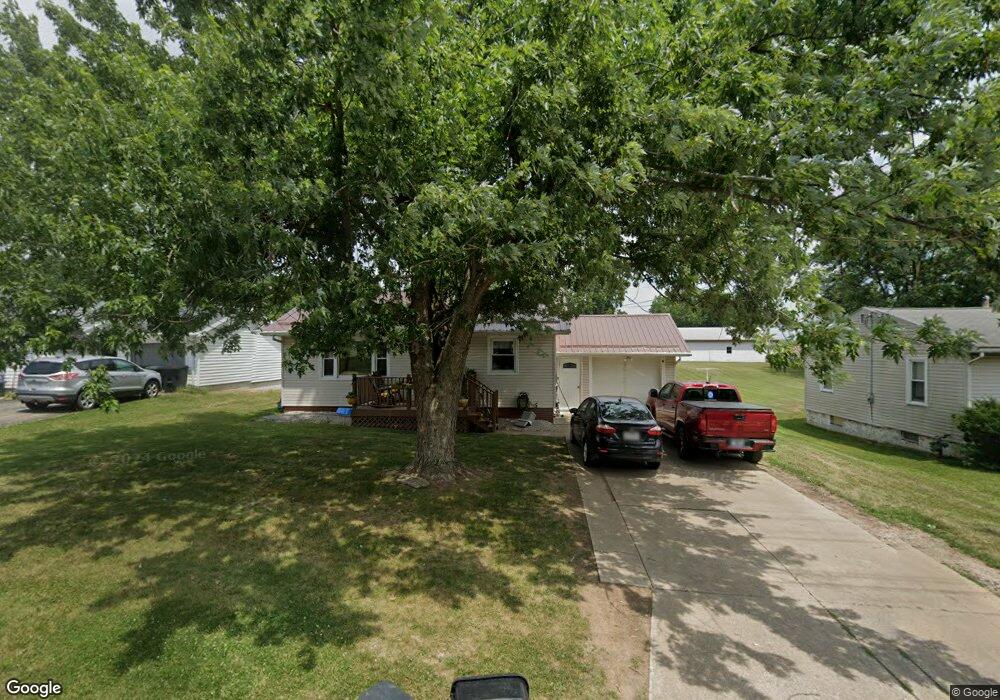
This home is located at 612 W 18th St, Ashland, OH 44805 and is currently estimated at $146,888, approximately $176 per square foot. 612 W 18th St is a home located in Ashland County with nearby schools including Ashland High School, Ashland County Community Academy, and St. Edward Elementary School.
Ownership History
Date
Name
Owned For
Owner Type
Purchase Details
Closed on
Aug 4, 2023
Sold by
Markel Timothy E
Bought by
Babcock Alicia Denise
Current Estimated Value
Home Financials for this Owner
Home Financials are based on the most recent Mortgage that was taken out on this home.
Original Mortgage
$100,152
Outstanding Balance
$97,810
Interest Rate
6.67%
Mortgage Type
Credit Line Revolving
Estimated Equity
$49,078
Purchase Details
Closed on
Aug 4, 2011
Sold by
Clay William H
Bought by
Markel Timothy E
Home Financials for this Owner
Home Financials are based on the most recent Mortgage that was taken out on this home.
Original Mortgage
$65,788
Interest Rate
4.5%
Mortgage Type
FHA
Purchase Details
Closed on
Nov 8, 2004
Sold by
Johnston Clarence F
Bought by
Clay William H
Purchase Details
Closed on
Sep 9, 1985
Sold by
Johnston Doris
Bought by
Johnston Clarence F
Create a Home Valuation Report for This Property
The Home Valuation Report is an in-depth analysis detailing your home's value as well as a comparison with similar homes in the area
Home Values in the Area
Average Home Value in this Area
Purchase History
| Date | Buyer | Sale Price | Title Company |
|---|---|---|---|
| Babcock Alicia Denise | $102,000 | Castle Real Estate Title | |
| Markel Timothy E | $67,500 | -- | |
| Clay William H | $72,500 | -- | |
| Johnston Clarence F | $38,300 | -- |
Source: Public Records
Mortgage History
| Date | Status | Borrower | Loan Amount |
|---|---|---|---|
| Open | Babcock Alicia Denise | $100,152 | |
| Previous Owner | Markel Timothy E | $65,788 |
Source: Public Records
Tax History Compared to Growth
Tax History
| Year | Tax Paid | Tax Assessment Tax Assessment Total Assessment is a certain percentage of the fair market value that is determined by local assessors to be the total taxable value of land and additions on the property. | Land | Improvement |
|---|---|---|---|---|
| 2024 | $939 | $27,160 | $4,490 | $22,670 |
| 2023 | $939 | $27,160 | $4,490 | $22,670 |
| 2022 | $652 | $23,620 | $3,910 | $19,710 |
| 2021 | $655 | $23,620 | $3,910 | $19,710 |
| 2020 | $620 | $23,620 | $3,910 | $19,710 |
| 2019 | $725 | $24,870 | $3,720 | $21,150 |
| 2018 | $732 | $24,870 | $3,720 | $21,150 |
| 2017 | $711 | $24,870 | $3,720 | $21,150 |
| 2016 | $711 | $23,690 | $3,540 | $20,150 |
| 2015 | $705 | $23,690 | $3,540 | $20,150 |
| 2013 | $850 | $17,700 | $3,510 | $14,190 |
Source: Public Records
Map
Nearby Homes