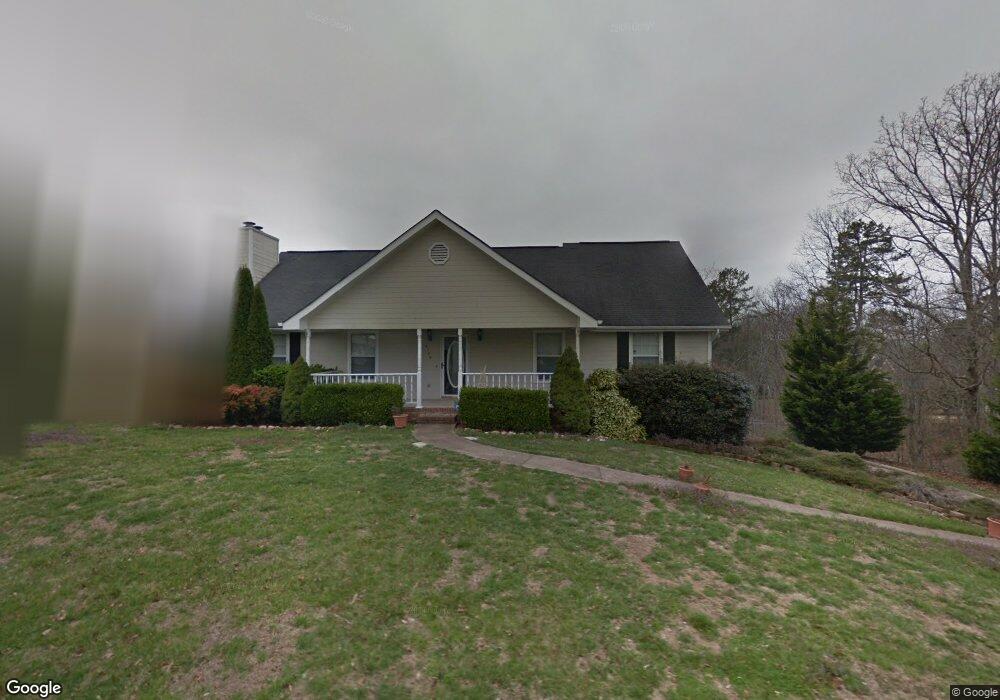
6120 Flag Point Dr Ooltewah, TN 37363
Estimated Value: $400,000 - $528,000
4
Beds
3
Baths
2,800
Sq Ft
$168/Sq Ft
Est. Value
About This Home
This home is located at 6120 Flag Point Dr, Ooltewah, TN 37363 and is currently estimated at $470,347, approximately $167 per square foot. 6120 Flag Point Dr is a home located in Hamilton County with nearby schools including Wallace A. Smith Elementary School, Hunter Middle School, and Ooltewah High School.
Ownership History
Date
Name
Owned For
Owner Type
Purchase Details
Closed on
Apr 3, 2019
Sold by
Harrington Scott A and Harrington Patricia L
Bought by
Harrington Scott A and Harrington Patricia L
Current Estimated Value
Purchase Details
Closed on
Aug 11, 2008
Sold by
Crowther Douglas M and Crowther Sherry V
Bought by
Harrington Patricia L and Harrington Scott A
Home Financials for this Owner
Home Financials are based on the most recent Mortgage that was taken out on this home.
Original Mortgage
$193,286
Outstanding Balance
$42,041
Interest Rate
6.43%
Mortgage Type
Credit Line Revolving
Estimated Equity
$428,306
Purchase Details
Closed on
Mar 30, 1999
Sold by
Bigger Donald E and Bigger Belinda D
Bought by
Crowther Douglas M and Crowther Sherry V
Home Financials for this Owner
Home Financials are based on the most recent Mortgage that was taken out on this home.
Original Mortgage
$137,750
Interest Rate
6.82%
Purchase Details
Closed on
Apr 21, 1995
Sold by
Freeman David L and Freeman Sherry
Bought by
Bigger Donald E and Bigger Belinda
Create a Home Valuation Report for This Property
The Home Valuation Report is an in-depth analysis detailing your home's value as well as a comparison with similar homes in the area
Home Values in the Area
Average Home Value in this Area
Purchase History
| Date | Buyer | Sale Price | Title Company |
|---|---|---|---|
| Harrington Scott A | -- | None Available | |
| Harrington Patricia L | $215,000 | None Available | |
| Crowther Douglas M | $145,000 | -- | |
| Bigger Donald E | $141,000 | -- |
Source: Public Records
Mortgage History
| Date | Status | Borrower | Loan Amount |
|---|---|---|---|
| Open | Harrington Patricia L | $193,286 | |
| Previous Owner | Crowther Douglas M | $137,750 |
Source: Public Records
Tax History
| Year | Tax Paid | Tax Assessment Tax Assessment Total Assessment is a certain percentage of the fair market value that is determined by local assessors to be the total taxable value of land and additions on the property. | Land | Improvement |
|---|---|---|---|---|
| 2025 | $1,798 | $118,600 | $0 | $0 |
| 2024 | $1,769 | $79,075 | $0 | $0 |
| 2023 | $1,778 | $79,075 | $0 | $0 |
| 2022 | $1,778 | $79,075 | $0 | $0 |
| 2021 | $1,778 | $79,075 | $0 | $0 |
| 2020 | $1,598 | $57,450 | $0 | $0 |
| 2019 | $1,598 | $57,450 | $0 | $0 |
| 2018 | $1,598 | $57,450 | $0 | $0 |
| 2017 | $1,598 | $59,825 | $0 | $0 |
| 2016 | $1,551 | $0 | $0 | $0 |
| 2015 | $1,551 | $55,750 | $0 | $0 |
| 2014 | $1,551 | $0 | $0 | $0 |
Source: Public Records
Map
Nearby Homes
- 6920 Knollcrest Dr
- 6831 Knollcrest Dr
- 6601 Flagstone Dr
- 7115 Snapdragon Ln
- 6747 Sawtooth Dr
- 7015 Lystra Rd
- 7050 Luke Ln
- 6015 Parsons Pond Dr
- 7004 Lystra Rd
- 6915 Sentinel Ln
- 10564 Fielding Rd
- 6110 Hunter Crest Dr
- 7004 Sleigh Ln
- 5958 Congress Ln
- 6061 Veronica Dr
- 7118 Flagstone Dr
- 4110 Flagway Dr
- 6039 Porter Dr
- 7356 Landlock Dr
- 7194 British Rd
- 6124 Flag Point Dr
- 6125 Flag Point Dr
- 6128 Flag Point Dr
- 6119 Flag Point Dr
- 6117 Flag Point Dr
- 6117 Flag Point Dr Unit 12
- 6110 Flag Point Dr
- 6202 Flag Point Dr
- 6127 Flag Point Dr
- 6106 Flag Point Dr
- 6113 Flag Point Dr
- 6113 Flag Point Dr Unit 12
- 6129 Flag Point Dr
- 6100 Flag Point Dr
- 6203 Flag Point Dr
- 6203 Flag Point Dr Unit 12
- 6105 Flag Point Dr
- 6109 Flag Point Dr
- 6206 Flag Point Dr
- 6209 Flag Point Dr
Your Personal Tour Guide
Ask me questions while you tour the home.