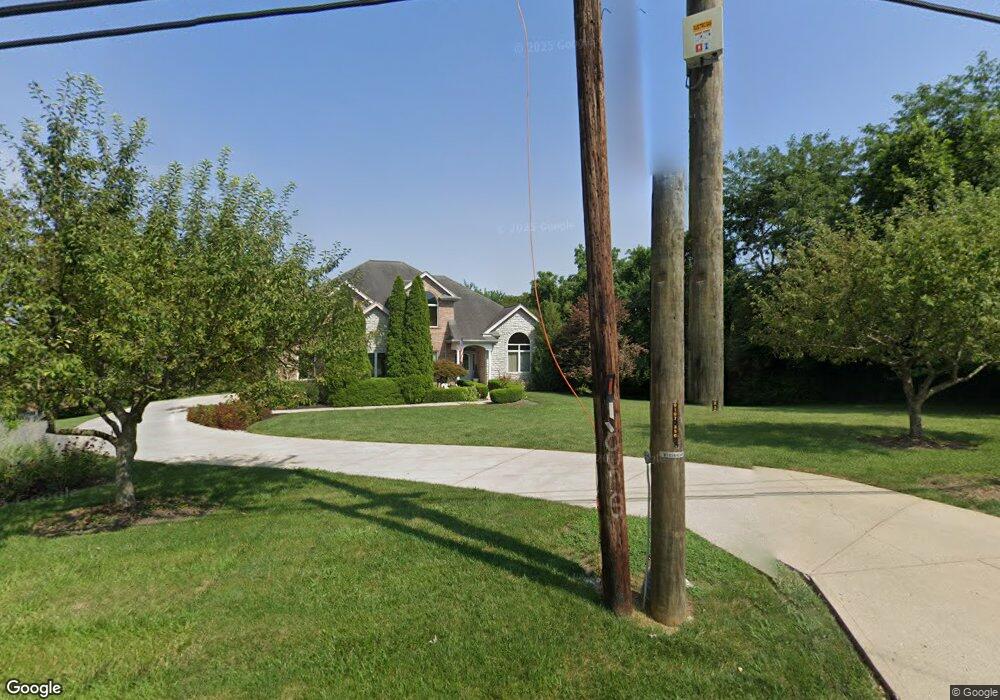
6120 Red Lion 5 Points Rd Springboro, OH 45066
Estimated Value: $655,000 - $765,000
5
Beds
5
Baths
3,134
Sq Ft
$225/Sq Ft
Est. Value
About This Home
This home is located at 6120 Red Lion 5 Points Rd, Springboro, OH 45066 and is currently estimated at $703,868, approximately $224 per square foot. 6120 Red Lion 5 Points Rd is a home located in Warren County with nearby schools including Clearcreek Elementary School, Dennis Elementary School, and Springboro Intermediate School.
Ownership History
Date
Name
Owned For
Owner Type
Purchase Details
Closed on
Jul 24, 2001
Sold by
Banford Scott A
Bought by
Bogan Richard A and Bogan Janet G
Current Estimated Value
Home Financials for this Owner
Home Financials are based on the most recent Mortgage that was taken out on this home.
Original Mortgage
$270,000
Outstanding Balance
$104,656
Interest Rate
7.22%
Mortgage Type
New Conventional
Estimated Equity
$599,212
Purchase Details
Closed on
May 3, 2000
Sold by
Birchfield Barry O
Bought by
Banford Scott A and Banford Laura D
Purchase Details
Closed on
Jul 29, 1987
Sold by
Barry Birchfield and Barry Ottis
Bought by
Barry Birchfield and Barry Ottis
Create a Home Valuation Report for This Property
The Home Valuation Report is an in-depth analysis detailing your home's value as well as a comparison with similar homes in the area
Home Values in the Area
Average Home Value in this Area
Purchase History
| Date | Buyer | Sale Price | Title Company |
|---|---|---|---|
| Bogan Richard A | $35,000 | -- | |
| Banford Scott A | $32,900 | -- | |
| Barry Birchfield | -- | -- |
Source: Public Records
Mortgage History
| Date | Status | Borrower | Loan Amount |
|---|---|---|---|
| Open | Bogan Richard A | $270,000 |
Source: Public Records
Tax History Compared to Growth
Tax History
| Year | Tax Paid | Tax Assessment Tax Assessment Total Assessment is a certain percentage of the fair market value that is determined by local assessors to be the total taxable value of land and additions on the property. | Land | Improvement |
|---|---|---|---|---|
| 2024 | $8,180 | $200,780 | $25,380 | $175,400 |
| 2023 | $7,568 | $169,267 | $14,469 | $154,798 |
| 2022 | $7,461 | $169,267 | $14,469 | $154,798 |
| 2021 | $6,971 | $169,267 | $14,469 | $154,798 |
| 2020 | $6,499 | $137,617 | $11,764 | $125,853 |
| 2019 | $6,022 | $137,617 | $11,764 | $125,853 |
| 2018 | $6,025 | $137,617 | $11,764 | $125,853 |
| 2017 | $6,026 | $123,858 | $10,686 | $113,173 |
| 2016 | $6,270 | $123,858 | $10,686 | $113,173 |
| 2015 | $6,275 | $123,858 | $10,686 | $113,173 |
| 2014 | $5,987 | $111,690 | $9,730 | $101,960 |
| 2013 | $5,984 | $134,910 | $11,550 | $123,360 |
Source: Public Records
Map
Nearby Homes
- 6265 Red Lion 5 Points Rd
- 980 Heatherwoode Cir
- 5944 Round Hill Ct
- 8 Glasgow St Unit 30
- 8 Glasgow St
- 18 Glasgow St Unit 29
- 18 Glasgow St
- 25 Morris St
- 25 Morris St Unit 13
- 45 Morris St Unit 15
- 45 Morris St
- 70 Morris St Unit 6
- 65 Morris St Unit 17
- 65 Morris St
- Hampton Plan at Northampton
- Cheswicke Plan at Northampton
- Barrett Plan at Northampton
- Hyde Park Plan at Northampton
- Melville Plan at Northampton
- Cooke Plan at Northampton
- 6170 Red Lion 5 Points Rd
- 6131 Red Lion 5 Points Rd
- 15 Balcomie Way
- 85 Keevers Point
- 65 Keevers Point
- 95 Keevers Point
- 45 Keevers Point
- 25 Keevers Point
- 30 Robinson Ct
- 585 Heatherwoode Cir
- 105 Keevers Point
- 50 Robinson Ct
- 579 Heatherwoode Cir
- 70 Robinson Ct
- 6200 Red Lion 5 Points Rd
- 80 Keevers Point
- 115 Keevers Point
- 90 Robinson Ct
- 6107 Red Lion 5 Points Rd
- 40 Keevers Point