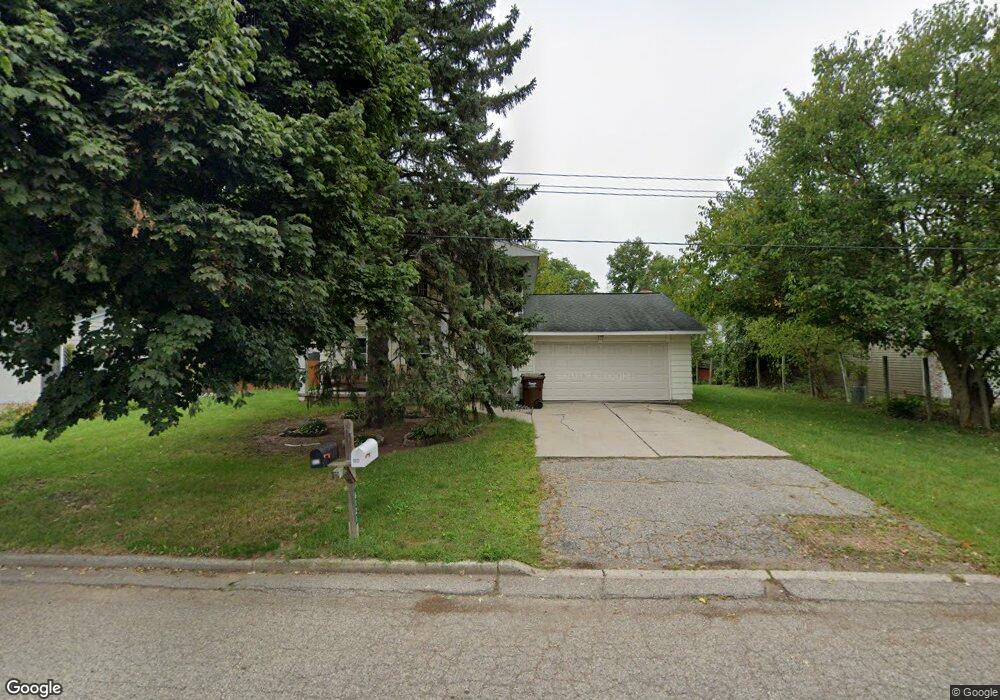
6121 Lerner Way Lansing, MI 48911
Southern Lansing NeighborhoodEstimated Value: $221,122 - $267,000
Studio
1
Bath
1,912
Sq Ft
$126/Sq Ft
Est. Value
About This Home
This home is located at 6121 Lerner Way, Lansing, MI 48911 and is currently estimated at $240,281, approximately $125 per square foot. 6121 Lerner Way is a home located in Ingham County with nearby schools including Forest View School, Attwood School, and Everett High School.
Ownership History
Date
Name
Owned For
Owner Type
Purchase Details
Closed on
Jun 29, 2023
Sold by
Thomas Imogene
Bought by
Thomas Imogene
Current Estimated Value
Purchase Details
Closed on
May 9, 2012
Sold by
Thomas Imogene
Bought by
Thomas Imogene and Dunn Bobbie Perdita
Purchase Details
Closed on
Jul 29, 2003
Sold by
Daniel Tyrone Scott
Bought by
Thomas Imogene
Home Financials for this Owner
Home Financials are based on the most recent Mortgage that was taken out on this home.
Original Mortgage
$132,850
Interest Rate
5.62%
Mortgage Type
Purchase Money Mortgage
Purchase Details
Closed on
Aug 17, 2000
Sold by
Rogers Danny S
Bought by
Daniel Tyrone Scott
Home Financials for this Owner
Home Financials are based on the most recent Mortgage that was taken out on this home.
Original Mortgage
$123,371
Interest Rate
8.12%
Mortgage Type
FHA
Create a Home Valuation Report for This Property
The Home Valuation Report is an in-depth analysis detailing your home's value as well as a comparison with similar homes in the area
Home Values in the Area
Average Home Value in this Area
Purchase History
| Date | Buyer | Sale Price | Title Company |
|---|---|---|---|
| Thomas Imogene | -- | None Listed On Document | |
| Thomas Imogene | -- | None Available | |
| Thomas Imogene | $137,500 | Transnation Title | |
| Daniel Tyrone Scott | -- | Trans | |
| Daniel Tyrone Scott | $125,000 | -- |
Source: Public Records
Mortgage History
| Date | Status | Borrower | Loan Amount |
|---|---|---|---|
| Previous Owner | Thomas Imogene | $132,850 | |
| Previous Owner | Daniel Tyrone Scott | $123,371 |
Source: Public Records
Tax History
| Year | Tax Paid | Tax Assessment Tax Assessment Total Assessment is a certain percentage of the fair market value that is determined by local assessors to be the total taxable value of land and additions on the property. | Land | Improvement |
|---|---|---|---|---|
| 2025 | $3,572 | $117,300 | $12,600 | $104,700 |
| 2024 | $28 | $91,700 | $12,600 | $79,100 |
| 2023 | $3,348 | $83,300 | $12,600 | $70,700 |
| 2022 | $3,017 | $71,900 | $12,600 | $59,300 |
| 2021 | $2,954 | $65,700 | $9,300 | $56,400 |
| 2020 | $2,936 | $62,300 | $9,300 | $53,000 |
| 2019 | $2,816 | $58,400 | $9,300 | $49,100 |
| 2018 | $2,637 | $52,500 | $9,300 | $43,200 |
| 2017 | $2,525 | $52,500 | $9,300 | $43,200 |
| 2016 | $2,415 | $46,400 | $9,300 | $37,100 |
| 2015 | $2,415 | $44,400 | $18,529 | $25,871 |
| 2014 | $2,415 | $43,100 | $26,952 | $16,148 |
Source: Public Records
Map
Nearby Homes
- 6115 Marscot Dr
- 6137 Scotmar Dr Unit 19
- 6129 Scotmar Dr Unit 15
- 1743 Maisonette Dr
- 6223 Beechfield Dr Unit 8
- 6264 Beechfield Dr Unit 97
- 6341 Beechfield Dr Unit 53
- 6300 Beechfield Dr Unit 87
- 6317 Beechfield Dr Unit 49
- 1521 Born Trail Unit lot 232
- 6704 Mill Stream Ln
- 2702 Yachtsman Dr
- 4485 Helmsway Dr
- 1265 Roth Dr
- 6815 Aurelius Rd
- 5808 Orchard Ct
- 2670 Brigantine Dr
- 2690 Halyard Dr
- 7011 Aurelius Rd
- 7061 W Bickett Blvd
- 6129 Lerner Way
- 6141 Scotmar Dr Unit 21
- 6122 Lerner Way
- 6137 Lerner Way
- 6143 Scotmar Dr Unit 22
- 6143 Scotmar Dr
- 6163 Scotmar Dr Unit 32
- 6105 Lerner Way
- 6145 Scotmar Dr
- 6130 Lerner Way
- 6161 Scotmar Dr Unit 31
- 6114 Lerner Way
- 6147 Scotmar Dr Unit 24
- 6157 Scotmar Dr Unit 29
- 6149 Scotmar Dr
- 6155 Scotmar Dr Unit 28
- 6151 Scotmar Dr
- 6136 Lerner Way
Your Personal Tour Guide
Ask me questions while you tour the home.