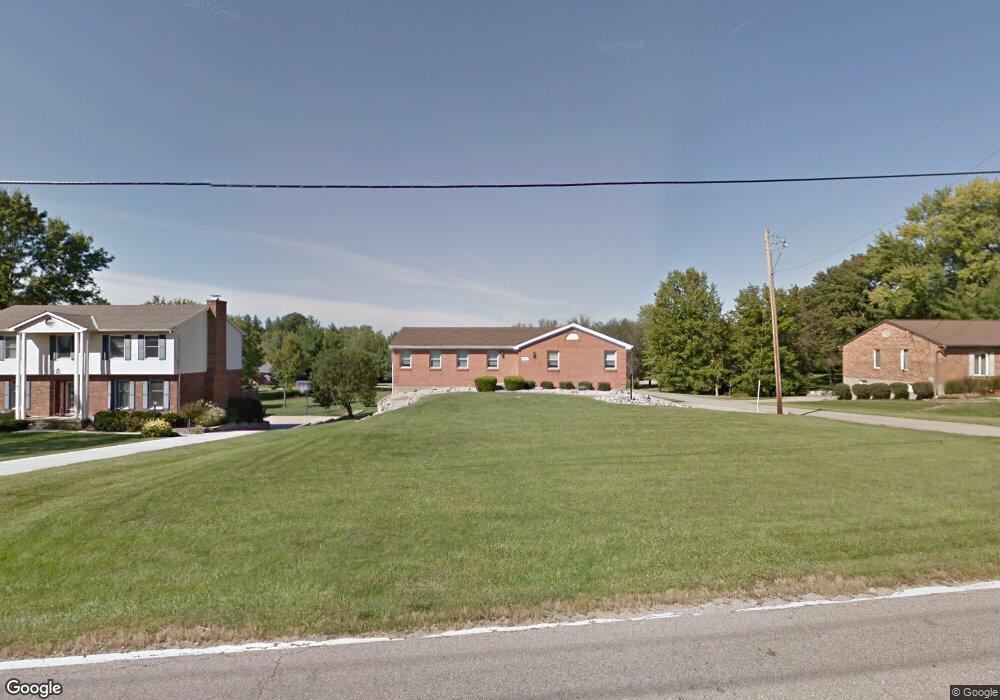
6122 W Fork Rd Cincinnati, OH 45247
Estimated Value: $284,443 - $306,000
2
Beds
3
Baths
1,554
Sq Ft
$190/Sq Ft
Est. Value
About This Home
This home is located at 6122 W Fork Rd, Cincinnati, OH 45247 and is currently estimated at $295,861, approximately $190 per square foot. 6122 W Fork Rd is a home located in Hamilton County with nearby schools including Monfort Heights Elementary School, White Oak Middle School, and Colerain High School.
Ownership History
Date
Name
Owned For
Owner Type
Purchase Details
Closed on
May 19, 2021
Sold by
Armbruster Rachel and Armbruster Matthew R
Bought by
Abusway Ronnie M
Current Estimated Value
Home Financials for this Owner
Home Financials are based on the most recent Mortgage that was taken out on this home.
Original Mortgage
$193,500
Outstanding Balance
$173,860
Interest Rate
3.1%
Mortgage Type
New Conventional
Estimated Equity
$122,001
Purchase Details
Closed on
Mar 23, 2018
Sold by
Morrissey Angela M and Morrissey Michael
Bought by
Weber Rachel and Armbruster Matthew R
Home Financials for this Owner
Home Financials are based on the most recent Mortgage that was taken out on this home.
Original Mortgage
$142,500
Interest Rate
4.46%
Mortgage Type
New Conventional
Purchase Details
Closed on
Sep 25, 2017
Sold by
Estate Of Sebastian P Milano
Bought by
Morrissey Angela M and Weber Christina M
Create a Home Valuation Report for This Property
The Home Valuation Report is an in-depth analysis detailing your home's value as well as a comparison with similar homes in the area
Home Values in the Area
Average Home Value in this Area
Purchase History
| Date | Buyer | Sale Price | Title Company |
|---|---|---|---|
| Abusway Ronnie M | $215,000 | Agility Closing & Ttl Svcs I | |
| Weber Rachel | $150,000 | None Available | |
| Morrissey Angela M | -- | None Available |
Source: Public Records
Mortgage History
| Date | Status | Borrower | Loan Amount |
|---|---|---|---|
| Open | Abusway Ronnie M | $193,500 | |
| Previous Owner | Weber Rachel | $142,500 |
Source: Public Records
Tax History
| Year | Tax Paid | Tax Assessment Tax Assessment Total Assessment is a certain percentage of the fair market value that is determined by local assessors to be the total taxable value of land and additions on the property. | Land | Improvement |
|---|---|---|---|---|
| 2025 | $4,084 | $75,250 | $16,800 | $58,450 |
| 2023 | $4,012 | $75,250 | $16,800 | $58,450 |
| 2022 | $3,429 | $52,500 | $17,640 | $34,860 |
| 2021 | $3,300 | $52,500 | $17,640 | $34,860 |
| 2020 | $3,259 | $52,500 | $17,640 | $34,860 |
| 2019 | $4,291 | $62,433 | $16,800 | $45,633 |
| 2018 | $3,833 | $62,433 | $16,800 | $45,633 |
| 2017 | $3,003 | $62,433 | $16,800 | $45,633 |
| 2016 | $2,886 | $59,661 | $16,632 | $43,029 |
| 2015 | $2,920 | $59,661 | $16,632 | $43,029 |
| 2014 | $2,925 | $59,661 | $16,632 | $43,029 |
| 2013 | $2,767 | $60,263 | $16,800 | $43,463 |
Source: Public Records
Map
Nearby Homes
- Site 1 Brierly Creek Rd
- 6051 Shelrich Ct
- 5442 Bluesky Dr
- 5804 Cedaridge Dr
- 5876 Sutters Mill Dr
- 5221 Clearlake Dr
- 5563 Haft Rd
- 6670 Gaines Rd
- 5588 W Fork Rd
- 6384 Conifer Ln
- 5207 S Eaglesnest Dr
- 6586 Hearne Rd Unit 2T
- 5473 Michelles Oak Ct
- 6617 Hearne Rd
- 6646 Hearne Rd
- 5547 Hubble Rd
- 5310 Rybolt Rd
- 7007 Boulder Path Dr
- 5073 Valley Ridge Rd
- 5104 Jonkard Ln
- 6106 W Fork Rd
- 6142 W Fork Rd
- 6092 W Fork Rd
- 6114 W Fork Rd
- 6150 W Fork Rd
- 6116 W Fork Rd
- 6109 W Fork Rd
- 6123 W Fork Rd
- 6067 W Fork Rd
- 6137 W Fork Rd
- 6166 W Fork Rd
- 6112 W Fork Rd
- 6164 W Fork Rd
- 6175 W Fork Rd
- 6149 W Fork Rd
- 6063 W Fork Rd
- 6168 W Fork Rd
- 6071 W Fork Rd Unit 3
- 6071 W Fork Rd
- 6157 W Fork Rd
Your Personal Tour Guide
Ask me questions while you tour the home.