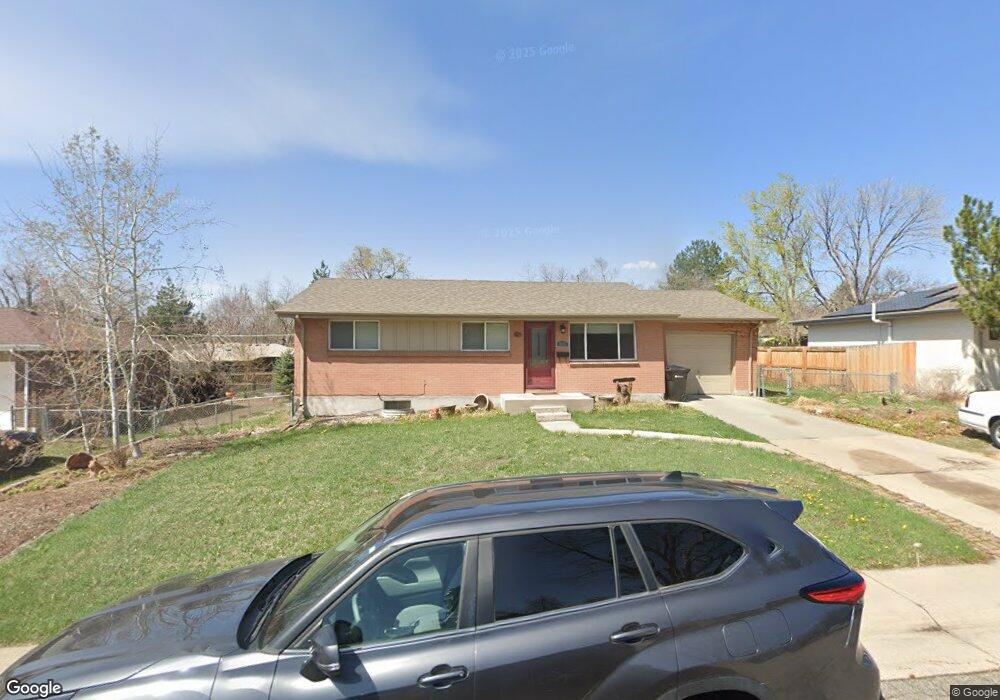
6123 Allison St Arvada, CO 80004
Alta Vista NeighborhoodEstimated Value: $591,693 - $684,000
4
Beds
2
Baths
2,072
Sq Ft
$306/Sq Ft
Est. Value
About This Home
This home is located at 6123 Allison St, Arvada, CO 80004 and is currently estimated at $633,923, approximately $305 per square foot. 6123 Allison St is a home located in Jefferson County with nearby schools including Lawrence Elementary School, North Arvada Middle School, and Arvada High School.
Ownership History
Date
Name
Owned For
Owner Type
Purchase Details
Closed on
Aug 30, 2021
Sold by
Johnson Tammy and Ruhnke Tammy Joyce
Bought by
Johnson Dana
Current Estimated Value
Purchase Details
Closed on
Jan 22, 2021
Sold by
Johnson Tammy
Bought by
Johnson Dona
Purchase Details
Closed on
Dec 8, 2010
Sold by
Denver Investment Group Inc
Bought by
Johnson Dana Jay and Ruhnke Tammy Joyce
Home Financials for this Owner
Home Financials are based on the most recent Mortgage that was taken out on this home.
Original Mortgage
$209,549
Outstanding Balance
$135,958
Interest Rate
3.87%
Mortgage Type
FHA
Estimated Equity
$497,965
Purchase Details
Closed on
Aug 13, 2010
Sold by
Stout Scott W
Bought by
Denver Investment Group Inc
Purchase Details
Closed on
Aug 9, 2010
Sold by
Stout Scott William
Bought by
Stout Scott W
Purchase Details
Closed on
Mar 23, 2010
Sold by
Stout Scott W
Bought by
Stout Scott W
Purchase Details
Closed on
Apr 4, 2007
Sold by
Schlenz Leonard A
Bought by
Schlenz Leann
Create a Home Valuation Report for This Property
The Home Valuation Report is an in-depth analysis detailing your home's value as well as a comparison with similar homes in the area
Home Values in the Area
Average Home Value in this Area
Purchase History
| Date | Buyer | Sale Price | Title Company |
|---|---|---|---|
| Johnson Dana | -- | None Available | |
| Johnson Dona | -- | None Available | |
| Johnson Dana Jay | $215,000 | Heritage Title | |
| Denver Investment Group Inc | $135,000 | Heritage Title | |
| Stout Scott W | -- | None Available | |
| Stout Scott W | -- | None Available | |
| Schlenz Leann | -- | None Available |
Source: Public Records
Mortgage History
| Date | Status | Borrower | Loan Amount |
|---|---|---|---|
| Open | Johnson Dana Jay | $209,549 |
Source: Public Records
Tax History
| Year | Tax Paid | Tax Assessment Tax Assessment Total Assessment is a certain percentage of the fair market value that is determined by local assessors to be the total taxable value of land and additions on the property. | Land | Improvement |
|---|---|---|---|---|
| 2024 | $3,521 | $36,296 | $17,540 | $18,756 |
| 2023 | $3,521 | $36,296 | $17,540 | $18,756 |
| 2022 | $2,839 | $28,992 | $12,750 | $16,242 |
| 2021 | $2,886 | $29,826 | $13,117 | $16,709 |
| 2020 | $2,630 | $27,254 | $11,479 | $15,775 |
| 2019 | $2,595 | $27,254 | $11,479 | $15,775 |
| 2018 | $2,280 | $23,283 | $6,474 | $16,809 |
| 2017 | $2,087 | $23,283 | $6,474 | $16,809 |
| 2016 | $1,789 | $18,577 | $5,539 | $13,038 |
| 2015 | $1,486 | $18,577 | $5,539 | $13,038 |
| 2014 | $1,486 | $14,679 | $4,872 | $9,807 |
Source: Public Records
Map
Nearby Homes
- 6176 Ammons St
- 6009 Yarrow St Unit K
- 6164 Brentwood St
- 6021 Yarrow St Unit B11
- 6007 Yarrow St Unit D
- 8243 Brooks Dr
- 6150 Carr St
- 7705 W 61st Ave
- 7963 W 62nd Way
- 8202 W 59th Ave
- 8410 Alta Vista Dr
- 8233 W 62nd Place
- 7605 W 62nd Ave
- 6175 Dover St
- 7313 W 60th Ave
- 7365 W 61st Ave
- 8401 W 64th Place
- 7303 W 59th Ave
- 6455 Orn Ville Aly
- 0000S Balsam St Unit 1
- 6113 Allison St
- 6133 Allison St
- 6126 Ammons St
- 6136 Ammons St
- 6116 Ammons St
- 6103 Allison St
- 6143 Allison St
- 6124 Allison St
- 6134 Allison St
- 6146 Ammons St
- 6114 Allison St
- 6144 Allison St
- 6106 Ammons St
- 6093 Allison St
- 6153 Allison St
- 6156 Ammons St
- 6104 Allison St
- 6154 Allison St
- 6096 Ammons St
- 6131 Ammons St
Your Personal Tour Guide
Ask me questions while you tour the home.