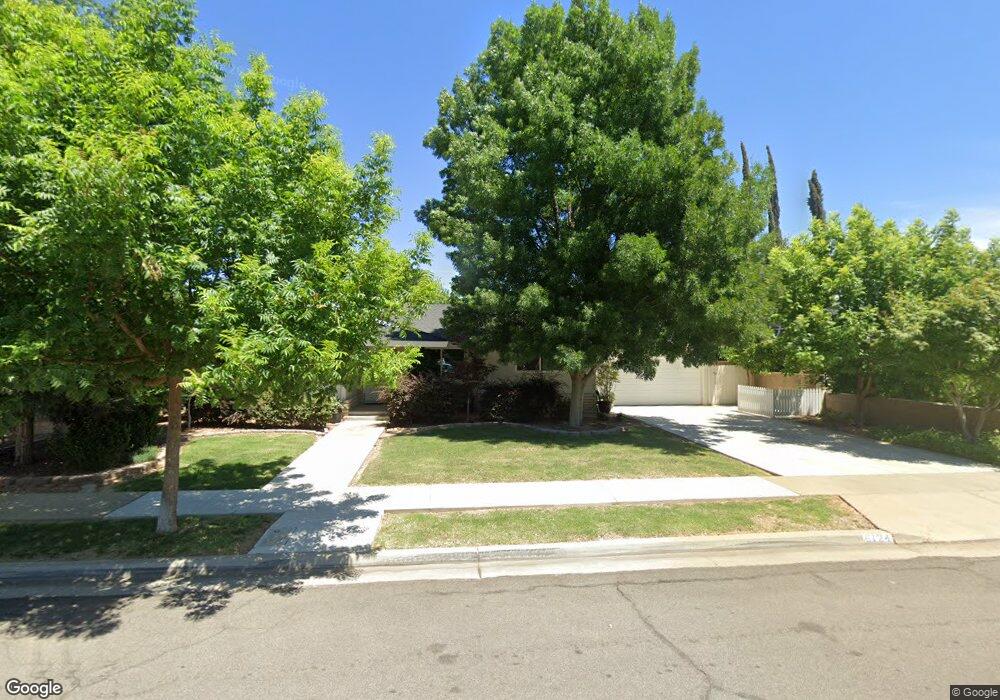
6124 N College Ave Fresno, CA 93704
Bullard NeighborhoodEstimated Value: $398,000 - $482,000
3
Beds
2
Baths
1,710
Sq Ft
$252/Sq Ft
Est. Value
About This Home
This home is located at 6124 N College Ave, Fresno, CA 93704 and is currently estimated at $431,152, approximately $252 per square foot. 6124 N College Ave is a home located in Fresno County with nearby schools including Kratt Elementary School, Tenaya Middle School, and Bullard High School.
Ownership History
Date
Name
Owned For
Owner Type
Purchase Details
Closed on
Sep 21, 2020
Sold by
Smith Patrick Howard and Smith Joan Marie
Bought by
Smith Joan Marie and Smith Patrick Howard
Current Estimated Value
Purchase Details
Closed on
Aug 4, 2010
Sold by
Gillis Susan Marie
Bought by
Smith Patrick H and Smith Joan
Home Financials for this Owner
Home Financials are based on the most recent Mortgage that was taken out on this home.
Original Mortgage
$130,140
Outstanding Balance
$85,642
Interest Rate
4.45%
Mortgage Type
New Conventional
Estimated Equity
$345,510
Purchase Details
Closed on
Jul 27, 2010
Sold by
Gillis Susan M
Bought by
Gillis David J and Gillis Susan M
Home Financials for this Owner
Home Financials are based on the most recent Mortgage that was taken out on this home.
Original Mortgage
$130,140
Outstanding Balance
$85,642
Interest Rate
4.45%
Mortgage Type
New Conventional
Estimated Equity
$345,510
Purchase Details
Closed on
Jun 19, 2002
Sold by
Gilgert Walter J
Bought by
Gilgert Walter J
Create a Home Valuation Report for This Property
The Home Valuation Report is an in-depth analysis detailing your home's value as well as a comparison with similar homes in the area
Home Values in the Area
Average Home Value in this Area
Purchase History
| Date | Buyer | Sale Price | Title Company |
|---|---|---|---|
| Smith Joan Marie | -- | None Available | |
| Smith Patrick H | $145,000 | Chicago Title Company | |
| Gillis David J | -- | None Available | |
| Gilgert Walter J | -- | -- |
Source: Public Records
Mortgage History
| Date | Status | Borrower | Loan Amount |
|---|---|---|---|
| Open | Smith Patrick H | $130,140 |
Source: Public Records
Tax History Compared to Growth
Tax History
| Year | Tax Paid | Tax Assessment Tax Assessment Total Assessment is a certain percentage of the fair market value that is determined by local assessors to be the total taxable value of land and additions on the property. | Land | Improvement |
|---|---|---|---|---|
| 2025 | $2,174 | $185,117 | $46,116 | $139,001 |
| 2023 | $2,131 | $177,930 | $44,326 | $133,604 |
| 2022 | $2,101 | $174,442 | $43,457 | $130,985 |
| 2021 | $2,041 | $171,022 | $42,605 | $128,417 |
| 2020 | $2,032 | $169,270 | $42,169 | $127,101 |
| 2019 | $1,951 | $165,952 | $41,343 | $124,609 |
| 2018 | $1,907 | $162,699 | $40,533 | $122,166 |
| 2017 | $1,873 | $159,510 | $39,739 | $119,771 |
| 2016 | $1,809 | $156,383 | $38,960 | $117,423 |
| 2015 | $1,780 | $154,035 | $38,375 | $115,660 |
| 2014 | $1,746 | $151,019 | $37,624 | $113,395 |
Source: Public Records
Map
Nearby Homes
- 365 W Escalon Ave
- 6164 N Maroa Ave
- 441 W Sample Ave
- 177 W Bullard Ave
- 411 W Vartikian Ave
- 6284 N Del Mar Ave
- 6316 N Poplar Ave
- 6171 N Calaveras St
- 317 W Sierra Ave Unit 124
- 317 W Sierra Ave Unit 107
- 317 W Sierra Ave Unit 125
- 6338 N Maroa Ave Unit 115
- 355 W Sierra Ave Unit 106
- 148 W Roberts Ave
- 6265 N Colonial Ave
- 71 W Sierra Ave
- 75 E Mesa Ave
- 6300 N Palm Ave Unit 125
- 6300 N Palm Ave Unit 105
- 665 W Escalon Ave
- 6134 N College Ave
- 6112 N College Ave
- 6146 N College Ave
- 6125 N College Ave
- 301 W Mesa Ave
- 318 W Mesa Ave
- 6135 N College Ave
- 6158 N College Ave
- 309 W Mesa Ave
- 6147 N College Ave
- 6126 N Bungalow Ln
- 319 W Mesa Ave
- 6114 N Bungalow Ln
- 6091 N Poplar Ave
- 6170 N College Ave
- 315 W Escalon Ave
- 340 W Stuart Ave
- 333 W Mesa Ave
- 329 W Escalon Ave
- 6063 N College Ave