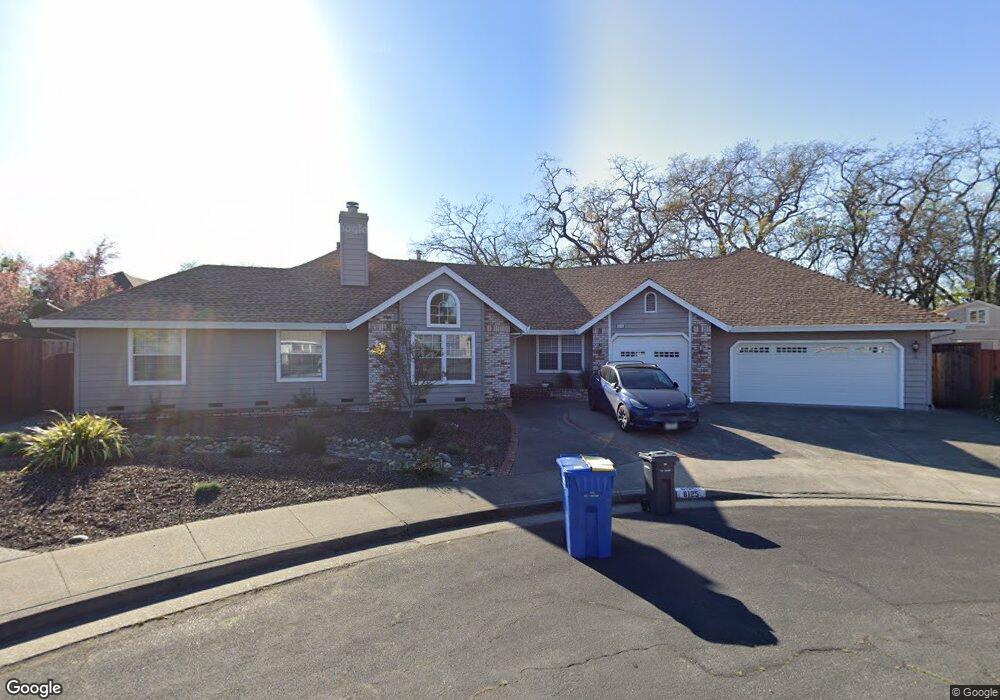
6125 Tyler Ct Windsor, CA 95492
Estimated Value: $968,000 - $1,179,000
4
Beds
3
Baths
2,589
Sq Ft
$404/Sq Ft
Est. Value
About This Home
This home is located at 6125 Tyler Ct, Windsor, CA 95492 and is currently estimated at $1,047,231, approximately $404 per square foot. 6125 Tyler Ct is a home located in Sonoma County with nearby schools including Mattie Washburn Elementary School, Brooks Elementary School, and Windsor Middle School.
Ownership History
Date
Name
Owned For
Owner Type
Purchase Details
Closed on
Sep 12, 2005
Sold by
Wotring Charlotte
Bought by
Wotring Charlotte and The Charlotte Wotring Trust
Current Estimated Value
Purchase Details
Closed on
Sep 14, 2001
Sold by
Campbell Marlene M
Bought by
Wotring Charlotte
Home Financials for this Owner
Home Financials are based on the most recent Mortgage that was taken out on this home.
Original Mortgage
$325,000
Outstanding Balance
$126,732
Interest Rate
6.99%
Estimated Equity
$920,499
Purchase Details
Closed on
Aug 22, 2001
Sold by
Wotring John L
Bought by
Wotring Charlotte
Home Financials for this Owner
Home Financials are based on the most recent Mortgage that was taken out on this home.
Original Mortgage
$325,000
Outstanding Balance
$126,732
Interest Rate
6.99%
Estimated Equity
$920,499
Create a Home Valuation Report for This Property
The Home Valuation Report is an in-depth analysis detailing your home's value as well as a comparison with similar homes in the area
Home Values in the Area
Average Home Value in this Area
Purchase History
| Date | Buyer | Sale Price | Title Company |
|---|---|---|---|
| Wotring Charlotte | -- | -- | |
| Wotring Charlotte | $575,000 | North American Title Co | |
| Wotring Charlotte | -- | North American Title Co |
Source: Public Records
Mortgage History
| Date | Status | Borrower | Loan Amount |
|---|---|---|---|
| Open | Wotring Charlotte | $325,000 |
Source: Public Records
Tax History
| Year | Tax Paid | Tax Assessment Tax Assessment Total Assessment is a certain percentage of the fair market value that is determined by local assessors to be the total taxable value of land and additions on the property. | Land | Improvement |
|---|---|---|---|---|
| 2025 | $9,974 | $849,450 | $192,043 | $657,407 |
| 2024 | $9,974 | $832,795 | $188,278 | $644,517 |
| 2023 | $9,974 | $816,467 | $184,587 | $631,880 |
| 2022 | $9,607 | $800,459 | $180,968 | $619,491 |
| 2021 | $9,452 | $784,765 | $177,420 | $607,345 |
| 2020 | $9,665 | $776,719 | $175,601 | $601,118 |
| 2019 | $9,600 | $761,490 | $172,158 | $589,332 |
| 2018 | $9,512 | $746,560 | $168,783 | $577,777 |
| 2017 | $9,421 | $731,923 | $165,474 | $566,449 |
| 2016 | $8,254 | $667,000 | $151,000 | $516,000 |
| 2015 | $7,319 | $596,000 | $135,000 | $461,000 |
| 2014 | $7,122 | $577,000 | $130,000 | $447,000 |
Source: Public Records
Map
Nearby Homes
- 6133 Tamara Ln
- 6283 Old Redwood Hwy
- 345 Wilson Ln
- 1145 Portello Ln
- 123 Dartmouth Way
- 129 Amanda Way
- 148 Amanda Way
- 156 Amanda Way
- 160 Amanda Way
- 6424 Apollo Place
- 13 Darcy Dr
- 83 Merner Dr
- 71 Merner Dr
- 705 Shiloh Rd
- 6276 Old Redwood Hwy
- 125 Anish Way
- 106 Shamrock Cir
- 156 Cornell St
- 172 Cornell St
- 6516 Hwy
Your Personal Tour Guide
Ask me questions while you tour the home.