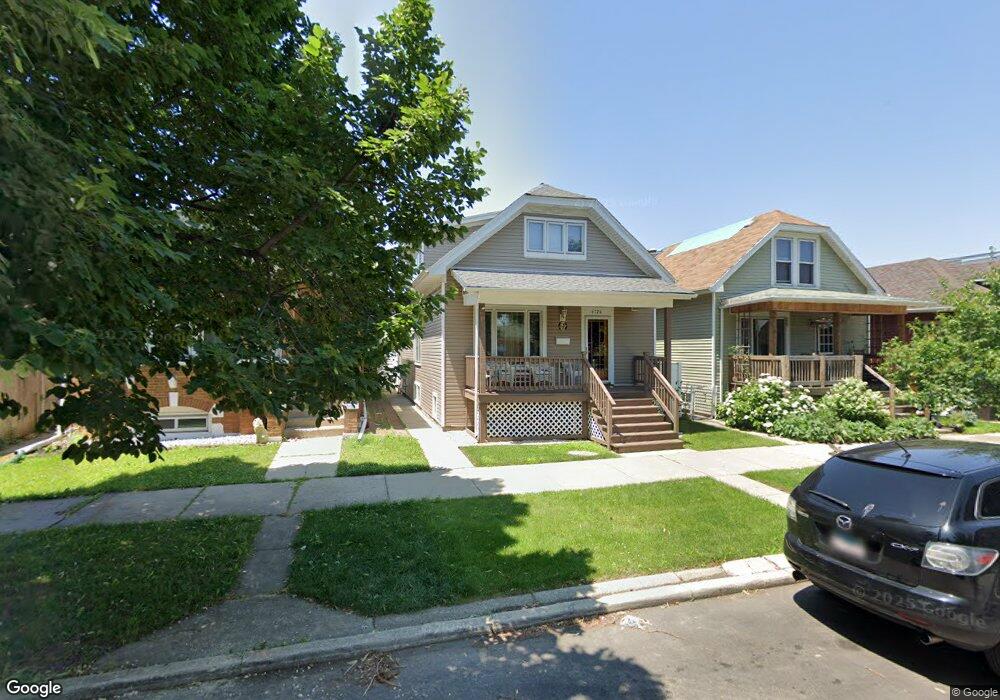
6126 S Menard Ave Chicago, IL 60638
Clearing NeighborhoodEstimated Value: $333,288 - $384,000
3
Beds
2
Baths
1,500
Sq Ft
$234/Sq Ft
Est. Value
About This Home
This home is located at 6126 S Menard Ave, Chicago, IL 60638 and is currently estimated at $350,429, approximately $233 per square foot. 6126 S Menard Ave is a home located in Cook County with nearby schools including Hale Elementary School, Kennedy High School, and St. Symphorosa Catholic School.
Ownership History
Date
Name
Owned For
Owner Type
Purchase Details
Closed on
Mar 28, 2011
Sold by
Vericrest Financial Inc
Bought by
Lehman Capital
Current Estimated Value
Purchase Details
Closed on
Mar 18, 2011
Sold by
U S Bank Na
Bought by
Garcia Lisa and Tamayo Manuel
Purchase Details
Closed on
Oct 20, 2007
Sold by
Cruz Nelson
Bought by
The Cit Group/Consumer Finance Inc
Purchase Details
Closed on
Oct 1, 2004
Sold by
Elhaj Adnan and Elhaj Ziyad
Bought by
Cruz Nelson
Home Financials for this Owner
Home Financials are based on the most recent Mortgage that was taken out on this home.
Original Mortgage
$199,500
Interest Rate
5.82%
Mortgage Type
Unknown
Purchase Details
Closed on
Jun 14, 2004
Sold by
Sukalo Barbara L
Bought by
Elhaj Adnan and Elhaj Ziyad
Home Financials for this Owner
Home Financials are based on the most recent Mortgage that was taken out on this home.
Original Mortgage
$156,000
Interest Rate
6.35%
Mortgage Type
Unknown
Create a Home Valuation Report for This Property
The Home Valuation Report is an in-depth analysis detailing your home's value as well as a comparison with similar homes in the area
Home Values in the Area
Average Home Value in this Area
Purchase History
| Date | Buyer | Sale Price | Title Company |
|---|---|---|---|
| Lehman Capital | -- | Cti | |
| Garcia Lisa | $75,000 | None Available | |
| U S Bank Na | -- | Cti | |
| The Cit Group/Consumer Finance Inc | -- | None Available | |
| Cruz Nelson | $210,000 | Pntn | |
| Elhaj Adnan | $195,000 | Multiple |
Source: Public Records
Mortgage History
| Date | Status | Borrower | Loan Amount |
|---|---|---|---|
| Previous Owner | Cruz Nelson | $199,500 | |
| Previous Owner | Elhaj Adnan | $156,000 |
Source: Public Records
Tax History Compared to Growth
Tax History
| Year | Tax Paid | Tax Assessment Tax Assessment Total Assessment is a certain percentage of the fair market value that is determined by local assessors to be the total taxable value of land and additions on the property. | Land | Improvement |
|---|---|---|---|---|
| 2024 | $3,539 | $26,000 | $5,292 | $20,708 |
| 2023 | $3,430 | $20,000 | $4,725 | $15,275 |
| 2022 | $3,430 | $20,000 | $4,725 | $15,275 |
| 2021 | $3,352 | $20,000 | $4,725 | $15,275 |
| 2020 | $3,113 | $16,988 | $3,780 | $13,208 |
| 2019 | $3,123 | $18,876 | $3,780 | $15,096 |
| 2018 | $3,070 | $18,876 | $3,780 | $15,096 |
| 2017 | $2,907 | $16,790 | $3,402 | $13,388 |
| 2016 | $2,882 | $16,790 | $3,402 | $13,388 |
| 2015 | $2,615 | $16,790 | $3,402 | $13,388 |
| 2014 | $2,398 | $15,392 | $3,213 | $12,179 |
| 2013 | $2,340 | $15,392 | $3,213 | $12,179 |
Source: Public Records
Map
Nearby Homes
- 6058 S Massasoit Ave
- 6005 S Menard Ave
- 6037 S Mason Ave
- 6016 S Mayfield Ave
- 6025 S Major Ave
- 6129 S Parkside Ave
- 6152 S Austin Ave
- 5817 W 64th St
- 6123 S Meade Ave
- 5749 W 64th Place
- 6155 S Moody Ave
- 5814 S Massasoit Ave
- 5533 W 63rd Place
- 5819 S Mason Ave
- 5631 W 64th Place
- 5827 S Austin Ave
- 6054 W 64th St
- 5810 S Austin Ave
- 5740 S Monitor Ave
- 6334 S Austin Ave
- 6130 S Menard Ave
- 6134 S Menard Ave
- 6124 S Menard Ave
- 6136 S Menard Ave
- 6122 S Menard Ave
- 6140 S Menard Ave
- 6142 S Menard Ave Unit 1
- 6120 S Menard Ave
- 6131 S Monitor Ave
- 6135 S Monitor Ave
- 6129 S Monitor Ave
- 6146 S Menard Ave
- 6116 S Menard Ave
- 6125 S Monitor Ave
- 6137 S Monitor Ave
- 6131 S Menard Ave
- 6123 S Monitor Ave
- 6141 S Monitor Ave
- 6137 S Menard Ave
- 6112 S Menard Ave