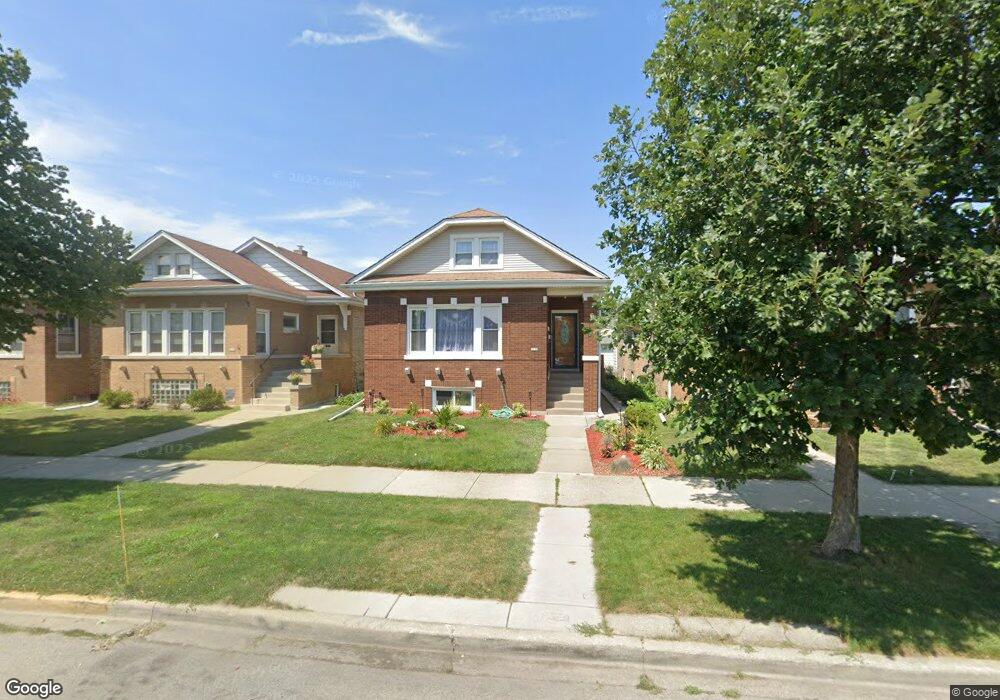
6126 W Patterson Ave Chicago, IL 60634
Portage Park NeighborhoodEstimated Value: $386,068 - $437,000
3
Beds
1
Bath
1,200
Sq Ft
$351/Sq Ft
Est. Value
About This Home
This home is located at 6126 W Patterson Ave, Chicago, IL 60634 and is currently estimated at $421,767, approximately $351 per square foot. 6126 W Patterson Ave is a home located in Cook County with nearby schools including Smyser Elementary School, Schurz High School, and Pope Francis Global Academy.
Ownership History
Date
Name
Owned For
Owner Type
Purchase Details
Closed on
Dec 15, 2004
Sold by
Nisiewicz Ryszard
Bought by
Stec Boguslaw and Nisiewicz Stec Bozena
Current Estimated Value
Home Financials for this Owner
Home Financials are based on the most recent Mortgage that was taken out on this home.
Original Mortgage
$165,000
Outstanding Balance
$78,288
Interest Rate
5.25%
Mortgage Type
New Conventional
Estimated Equity
$343,479
Purchase Details
Closed on
Feb 17, 2000
Sold by
Nowacki Zbigniew
Bought by
Stec Boguslaw and Nisiewicz Stec Bozena
Home Financials for this Owner
Home Financials are based on the most recent Mortgage that was taken out on this home.
Original Mortgage
$169,500
Interest Rate
7.37%
Purchase Details
Closed on
Dec 1, 1997
Sold by
Burke Coleman and Burke Ellen
Bought by
Nowacki Zbigniew
Home Financials for this Owner
Home Financials are based on the most recent Mortgage that was taken out on this home.
Original Mortgage
$137,000
Interest Rate
7.46%
Create a Home Valuation Report for This Property
The Home Valuation Report is an in-depth analysis detailing your home's value as well as a comparison with similar homes in the area
Home Values in the Area
Average Home Value in this Area
Purchase History
| Date | Buyer | Sale Price | Title Company |
|---|---|---|---|
| Stec Boguslaw | -- | Stewart Title Of Illinois | |
| Stec Boguslaw | $217,500 | -- | |
| Nowacki Zbigniew | $144,500 | Chicago Title Insurance Co |
Source: Public Records
Mortgage History
| Date | Status | Borrower | Loan Amount |
|---|---|---|---|
| Open | Stec Boguslaw | $165,000 | |
| Previous Owner | Stec Boguslaw | $169,500 | |
| Previous Owner | Nowacki Zbigniew | $137,000 |
Source: Public Records
Tax History
| Year | Tax Paid | Tax Assessment Tax Assessment Total Assessment is a certain percentage of the fair market value that is determined by local assessors to be the total taxable value of land and additions on the property. | Land | Improvement |
|---|---|---|---|---|
| 2025 | $5,097 | $31,001 | $14,438 | $16,563 |
| 2024 | $5,097 | $31,001 | $14,438 | $16,563 |
| 2023 | $5,493 | $30,126 | $11,550 | $18,576 |
| 2022 | $5,493 | $30,126 | $11,550 | $18,576 |
| 2021 | $5,388 | $30,126 | $11,550 | $18,576 |
| 2020 | $3,795 | $20,138 | $5,156 | $14,982 |
| 2019 | $3,857 | $22,628 | $5,156 | $17,472 |
| 2018 | $3,791 | $22,628 | $5,156 | $17,472 |
| 2017 | $3,949 | $21,721 | $4,537 | $17,184 |
| 2016 | $3,850 | $21,721 | $4,537 | $17,184 |
| 2015 | $3,500 | $21,721 | $4,537 | $17,184 |
| 2014 | $3,645 | $22,214 | $4,125 | $18,089 |
| 2013 | $3,562 | $22,214 | $4,125 | $18,089 |
Source: Public Records
Map
Nearby Homes
- 6052 W Eddy St
- 6217 W Grace St
- 6109 W Berenice Ave
- 6227 W Addison St
- 6258 W Patterson Ave
- 6007 W Berenice Ave
- 6337 W Patterson Ave
- 6336 W Addison St
- 6243 W Byron St
- 6308 W Cornelia Ave
- 6333 W Cornelia Ave
- 3507 N Narragansett Ave
- 3853 N Narragansett Ave Unit 203
- 5758 W Warwick Ave
- 5853 W Newport Ave
- 6226 W Irving Park Rd
- 6342 W Henderson St
- 6049 W School St
- 5752 W Byron St
- 4065 N Meade Ave
- 6124 W Patterson Ave
- 6130 W Patterson Ave
- 6120 W Patterson Ave
- 6134 W Patterson Ave
- 6136 W Patterson Ave
- 6118 W Patterson Ave
- 6140 W Patterson Ave
- 6114 W Patterson Ave
- 6129 W Waveland Ave
- 6131 W Waveland Ave
- 6125 W Waveland Ave
- 6121 W Waveland Ave
- 6135 W Waveland Ave
- 6144 W Patterson Ave
- 6110 W Patterson Ave
- 6119 W Waveland Ave
- 6137 W Waveland Ave
- 6129 W Patterson Ave
- 6115 W Waveland Ave
- 6131 W Patterson Ave
Your Personal Tour Guide
Ask me questions while you tour the home.