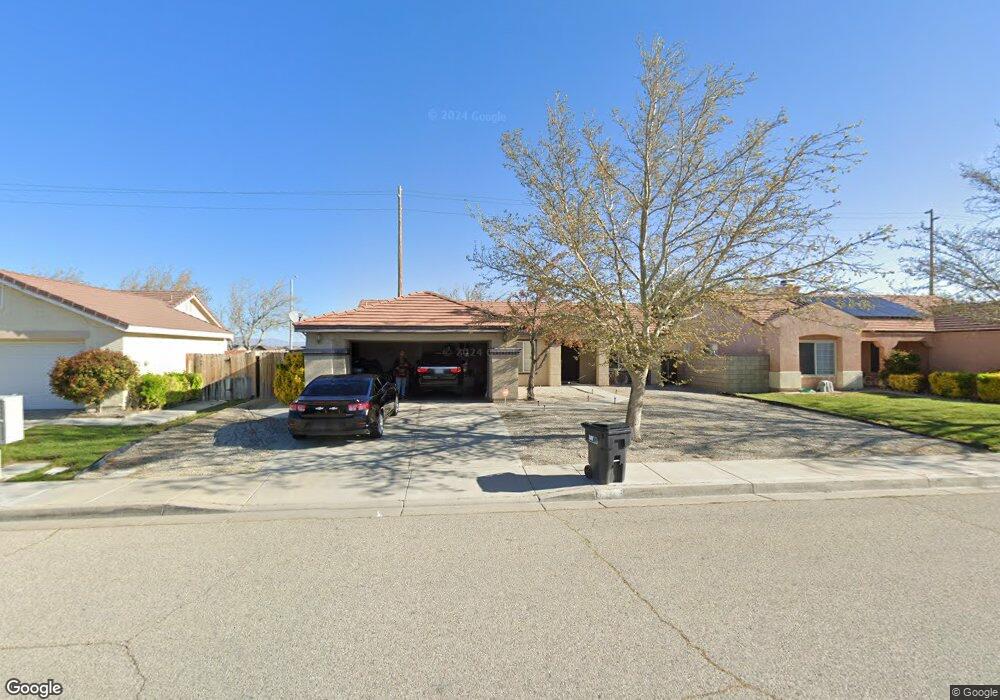
6127 Golding Dr Lancaster, CA 93536
West Lancaster NeighborhoodEstimated Value: $414,000 - $459,000
3
Beds
2
Baths
1,227
Sq Ft
$350/Sq Ft
Est. Value
About This Home
This home is located at 6127 Golding Dr, Lancaster, CA 93536 and is currently estimated at $429,137, approximately $349 per square foot. 6127 Golding Dr is a home located in Los Angeles County with nearby schools including Sundown Elementary School, Quartz Hill High School, and Fabunni Private School Inc..
Ownership History
Date
Name
Owned For
Owner Type
Purchase Details
Closed on
Feb 7, 2014
Sold by
Housepath Partners Lp
Bought by
Equity Trust Company and Marici Cook Ira
Current Estimated Value
Home Financials for this Owner
Home Financials are based on the most recent Mortgage that was taken out on this home.
Original Mortgage
$87,500
Outstanding Balance
$46,130
Interest Rate
4.34%
Mortgage Type
New Conventional
Estimated Equity
$383,007
Purchase Details
Closed on
Nov 19, 2013
Sold by
Ray Kerry Bruce and Ray Jessie Lynn
Bought by
Housepath Partners Lp
Purchase Details
Closed on
Jun 26, 2006
Sold by
Ray Jessie Lynn
Bought by
Ray Kerry Bruce
Purchase Details
Closed on
Mar 7, 2001
Sold by
Healy Derrick C and Healy Shari J
Bought by
Ray Kerry Bruce and Ray Jessie Lynn
Home Financials for this Owner
Home Financials are based on the most recent Mortgage that was taken out on this home.
Original Mortgage
$109,917
Interest Rate
7.19%
Mortgage Type
FHA
Create a Home Valuation Report for This Property
The Home Valuation Report is an in-depth analysis detailing your home's value as well as a comparison with similar homes in the area
Home Values in the Area
Average Home Value in this Area
Purchase History
| Date | Buyer | Sale Price | Title Company |
|---|---|---|---|
| Equity Trust Company | $175,001 | Title365 | |
| Housepath Partners Lp | -- | None Available | |
| Ray Kerry Bruce | -- | None Available | |
| Ray Kerry Bruce | $111,000 | Fidelity National Title Co |
Source: Public Records
Mortgage History
| Date | Status | Borrower | Loan Amount |
|---|---|---|---|
| Open | Equity Trust Company | $87,500 | |
| Previous Owner | Ray Kerry Bruce | $109,917 |
Source: Public Records
Tax History Compared to Growth
Tax History
| Year | Tax Paid | Tax Assessment Tax Assessment Total Assessment is a certain percentage of the fair market value that is determined by local assessors to be the total taxable value of land and additions on the property. | Land | Improvement |
|---|---|---|---|---|
| 2025 | $4,009 | $214,515 | $42,900 | $171,615 |
| 2024 | $4,009 | $210,309 | $42,059 | $168,250 |
| 2023 | $3,964 | $206,186 | $41,235 | $164,951 |
| 2022 | $3,769 | $202,144 | $40,427 | $161,717 |
| 2021 | $3,374 | $198,182 | $39,635 | $158,547 |
| 2019 | $3,296 | $192,306 | $38,460 | $153,846 |
| 2018 | $3,252 | $188,536 | $37,706 | $150,830 |
| 2016 | $3,096 | $181,217 | $36,243 | $144,974 |
| 2015 | $3,064 | $178,496 | $35,699 | $142,797 |
| 2014 | $3,096 | $140,800 | $36,000 | $104,800 |
Source: Public Records
Map
Nearby Homes
- 44306 62nd St W
- 44613 62nd St W
- 44232 62nd St W
- 6045 W Avenue j3
- 0 W Avenue J 4
- 44220 Encanto Way
- 0 Vac Ave E Drt Vic 63rd Stw
- 6211 Oldfield St
- 0 60 Th St W & Ave J-6 Unit 25005111
- 6327 W Avenue j5
- 5789 Golding Dr
- 6231 Jasper Ct
- 0 61st St W
- 44539 Freer Way
- 6324 Jasper Ct
- 6304 Starview Dr
- 6118 W Avenue J 9
- 43869 Hampton St
- 0 65th St West and J8 Unit 25002929
- 43843 Freer Way
- 6121 Golding Dr
- 6133 Golding Dr
- 6134 W Ave J 12
- 6119 Golding Dr
- 6139 Golding Dr
- 44343 Brandon Thomas Way
- 6118 Golding Dr
- 6109 Golding Dr
- 6145 Golding Dr
- 6112 Golding Dr
- 44337 Brandon Thomas Way
- 44318 62nd St W
- 6103 Golding Dr
- 44334 Brandon Thomas Way
- 6106 Golding Dr
- 44312 62nd St W
- 44331 Brandon Thomas Way
- 44335 Hazel Ct
- 6055 Golding Dr
- 44328 Brandon Thomas Way