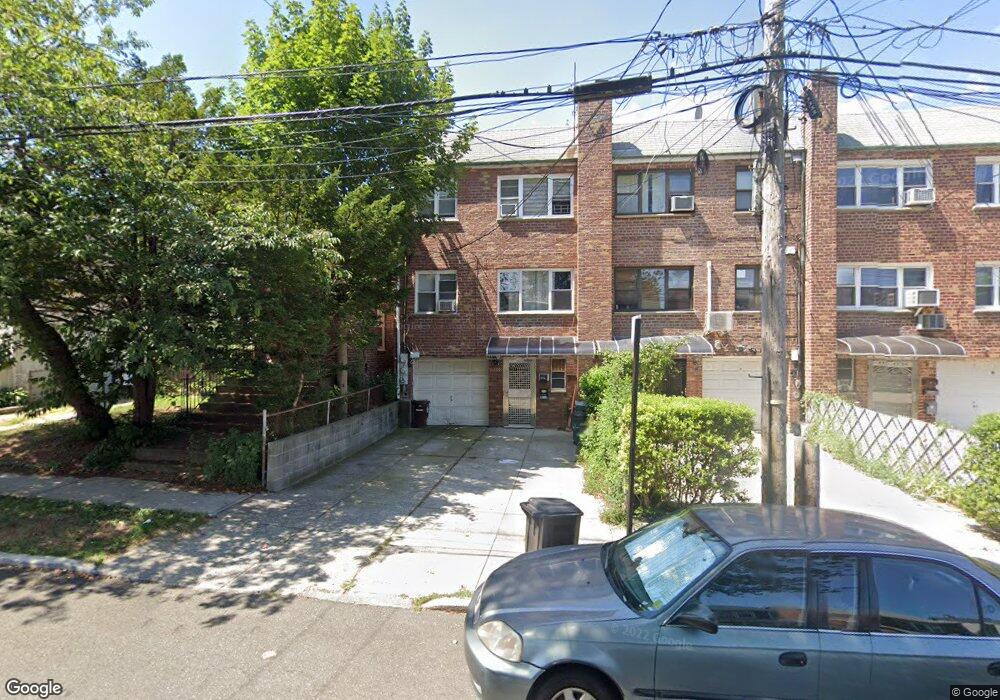
6128 160th St Fresh Meadows, NY 11365
Pomonok NeighborhoodEstimated Value: $930,000 - $1,567,000
--
Bed
--
Bath
2,200
Sq Ft
$595/Sq Ft
Est. Value
About This Home
This home is located at 6128 160th St, Fresh Meadows, NY 11365 and is currently estimated at $1,308,623, approximately $594 per square foot. 6128 160th St is a home located in Queens County with nearby schools including P.S. 201 - The Discovery School for Inquiry & Research, Rachel Carson I.S. 237Q, and The Lowell School.
Ownership History
Date
Name
Owned For
Owner Type
Purchase Details
Closed on
Aug 9, 2007
Sold by
Chen Shiow Chih and Lai Monica
Bought by
Huang Quan Mei and Huang Song Qin
Current Estimated Value
Home Financials for this Owner
Home Financials are based on the most recent Mortgage that was taken out on this home.
Original Mortgage
$400,000
Outstanding Balance
$252,477
Interest Rate
6.78%
Mortgage Type
Purchase Money Mortgage
Estimated Equity
$1,056,146
Purchase Details
Closed on
Jan 12, 2007
Sold by
Spiro Idith and Spiro Martin
Bought by
Chen Shiow Chih and Lai Monica
Home Financials for this Owner
Home Financials are based on the most recent Mortgage that was taken out on this home.
Original Mortgage
$530,000
Interest Rate
6.15%
Mortgage Type
Purchase Money Mortgage
Create a Home Valuation Report for This Property
The Home Valuation Report is an in-depth analysis detailing your home's value as well as a comparison with similar homes in the area
Home Values in the Area
Average Home Value in this Area
Purchase History
| Date | Buyer | Sale Price | Title Company |
|---|---|---|---|
| Huang Quan Mei | $850,000 | -- | |
| Huang Quan Mei | $850,000 | -- | |
| Chen Shiow Chih | $665,000 | -- | |
| Chen Shiow Chih | $665,000 | -- |
Source: Public Records
Mortgage History
| Date | Status | Borrower | Loan Amount |
|---|---|---|---|
| Open | Huang Quan Mei | $400,000 | |
| Closed | Huang Quan Mei | $400,000 | |
| Previous Owner | Chen Shiow Chih | $530,000 |
Source: Public Records
Tax History Compared to Growth
Tax History
| Year | Tax Paid | Tax Assessment Tax Assessment Total Assessment is a certain percentage of the fair market value that is determined by local assessors to be the total taxable value of land and additions on the property. | Land | Improvement |
|---|---|---|---|---|
| 2025 | $9,714 | $51,595 | $16,374 | $35,221 |
| 2024 | $9,726 | $49,766 | $17,588 | $32,178 |
| 2023 | $9,421 | $48,306 | $14,529 | $33,777 |
| 2022 | $8,811 | $65,160 | $18,660 | $46,500 |
| 2021 | $8,753 | $63,780 | $18,660 | $45,120 |
| 2020 | $8,805 | $63,060 | $18,660 | $44,400 |
| 2019 | $8,383 | $66,000 | $18,660 | $47,340 |
| 2018 | $7,908 | $40,255 | $12,226 | $28,029 |
| 2017 | $7,442 | $37,977 | $11,870 | $26,107 |
| 2016 | $6,853 | $37,977 | $11,870 | $26,107 |
| 2015 | $4,101 | $35,830 | $15,038 | $20,792 |
| 2014 | $4,101 | $34,560 | $16,793 | $17,767 |
Source: Public Records
Map
Nearby Homes
- 61-26 160th St
- 5944 159th St
- 6133 157th St
- 16216 65th Ave
- 156-14 65th Ave
- 159-08 59th Ave
- 6126 164th St
- 59-32 164th St
- 154-39 64th Ave
- 57-19 Parsons Blvd
- 5728 Parsons Blvd Unit Front
- 160-12 Booth Memorial Ave
- 57-12 164th St
- 65-26 167th St
- 16604 67th Ave
- 153-51 Horace Harding Expy
- 65-47 167th St
- 6547 167th St
- 166-03 69th Ave
- 152-72 Melbourne Ave Unit 1D
- 6126 160th St
- 6132 160th St
- 61-38 160th St
- 6124 160th St
- 61-36 160th St Unit 1th Fl
- 6134 160th St
- 6122 160th St
- 61-22 160th St
- 6122 160th St Unit 2FL
- 6122 160th St
- 61-22 160th St Unit 2 Fl
- 6138 160th St
- 6129 159th St
- 6127 159th St
- 6131 159th St
- 6123 159th St
- 6116 160th St
- 61-40 160th St Unit 2 Fl
- 61-40 160th St
- 6140 160th St Unit 2 Fl