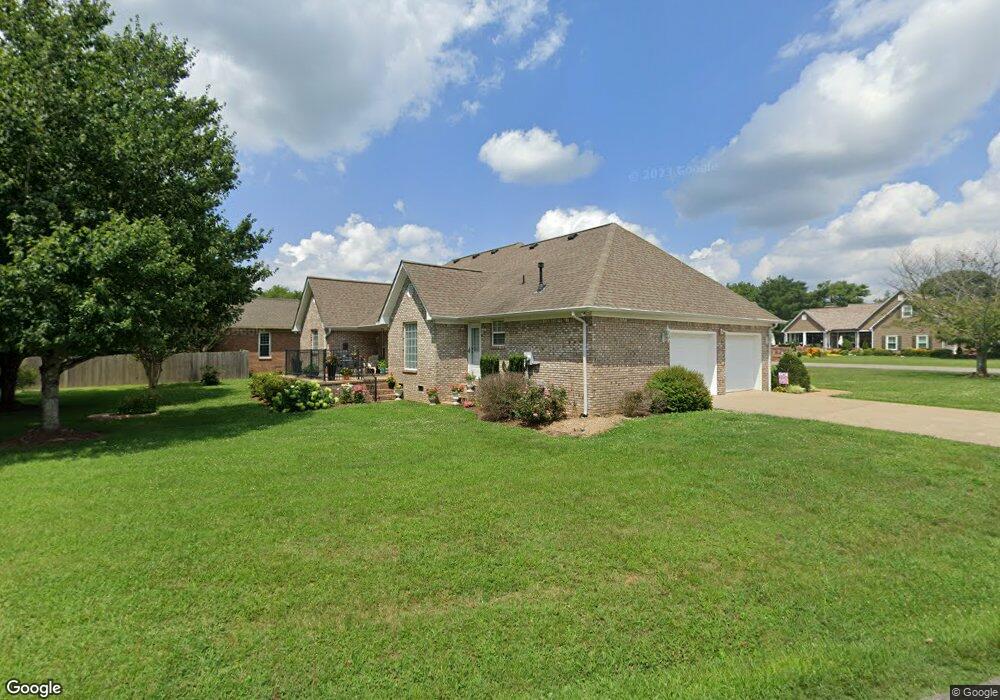
613 Aspen Ct Lawrenceburg, TN 38464
Estimated Value: $340,900 - $433,000
--
Bed
3
Baths
2,168
Sq Ft
$181/Sq Ft
Est. Value
About This Home
This home is located at 613 Aspen Ct, Lawrenceburg, TN 38464 and is currently estimated at $392,975, approximately $181 per square foot. 613 Aspen Ct is a home located in Lawrence County with nearby schools including Ingram Sowell Elementary School, Lawrenceburg Public Elementary School, and David Crockett Elementary School.
Ownership History
Date
Name
Owned For
Owner Type
Purchase Details
Closed on
Jul 14, 1999
Sold by
Larry Braswell
Bought by
Rigsby Robert B and Rigsby Linda L
Current Estimated Value
Home Financials for this Owner
Home Financials are based on the most recent Mortgage that was taken out on this home.
Original Mortgage
$118,400
Interest Rate
7.66%
Purchase Details
Closed on
May 2, 1988
Bought by
Braswell Larry and Braswell Linda
Create a Home Valuation Report for This Property
The Home Valuation Report is an in-depth analysis detailing your home's value as well as a comparison with similar homes in the area
Home Values in the Area
Average Home Value in this Area
Purchase History
| Date | Buyer | Sale Price | Title Company |
|---|---|---|---|
| Rigsby Robert B | $20,000 | -- | |
| Braswell Larry | -- | -- |
Source: Public Records
Mortgage History
| Date | Status | Borrower | Loan Amount |
|---|---|---|---|
| Closed | Braswell Larry | $118,400 |
Source: Public Records
Tax History Compared to Growth
Tax History
| Year | Tax Paid | Tax Assessment Tax Assessment Total Assessment is a certain percentage of the fair market value that is determined by local assessors to be the total taxable value of land and additions on the property. | Land | Improvement |
|---|---|---|---|---|
| 2025 | $2,489 | $80,075 | $0 | $0 |
| 2024 | $2,489 | $80,075 | $7,500 | $72,575 |
| 2023 | $2,489 | $80,075 | $7,500 | $72,575 |
| 2022 | $2,489 | $80,075 | $7,500 | $72,575 |
| 2021 | $2,164 | $49,225 | $6,250 | $42,975 |
| 2020 | $2,164 | $49,225 | $6,250 | $42,975 |
| 2019 | $2,164 | $49,225 | $6,250 | $42,975 |
| 2018 | $2,164 | $49,225 | $6,250 | $42,975 |
| 2017 | $2,164 | $49,225 | $6,250 | $42,975 |
| 2016 | $2,164 | $49,225 | $6,250 | $42,975 |
| 2015 | $2,049 | $49,225 | $6,250 | $42,975 |
| 2014 | $1,931 | $46,400 | $5,000 | $41,400 |
Source: Public Records
Map
Nearby Homes