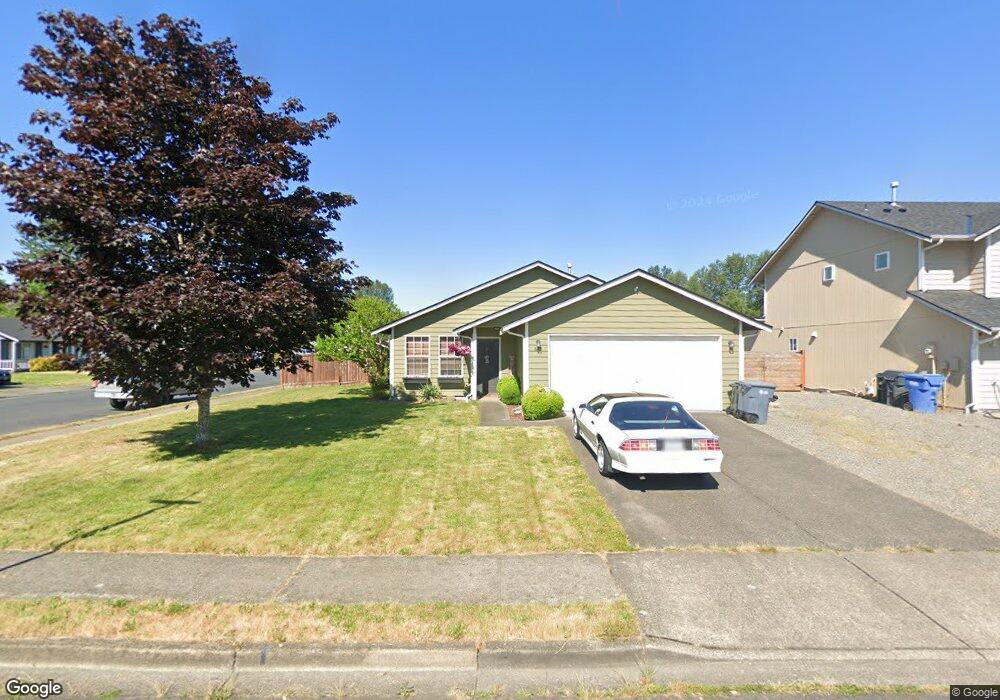
613 Burnett Ct NW Orting, WA 98360
Estimated Value: $442,000 - $490,000
3
Beds
2
Baths
1,116
Sq Ft
$420/Sq Ft
Est. Value
About This Home
This home is located at 613 Burnett Ct NW, Orting, WA 98360 and is currently estimated at $468,749, approximately $420 per square foot. 613 Burnett Ct NW is a home located in Pierce County with nearby schools including Orting Elementary School, Ptarmigan Ridge Elementary School, and Orting Middle School.
Ownership History
Date
Name
Owned For
Owner Type
Purchase Details
Closed on
Mar 7, 2006
Sold by
Bowman Eric P and Bowman Marisa B C
Bought by
Lynch Brian and Collette Kami L
Current Estimated Value
Home Financials for this Owner
Home Financials are based on the most recent Mortgage that was taken out on this home.
Original Mortgage
$183,900
Interest Rate
6.75%
Mortgage Type
Fannie Mae Freddie Mac
Purchase Details
Closed on
Nov 21, 2002
Sold by
Kaelin Brian and Kaelin Lindsay R
Bought by
Bowman Eric P and Bowman Marisa B C
Home Financials for this Owner
Home Financials are based on the most recent Mortgage that was taken out on this home.
Original Mortgage
$152,605
Interest Rate
6.12%
Mortgage Type
FHA
Purchase Details
Closed on
Oct 26, 1999
Sold by
Pro Staff Development Inc
Bought by
Kaelin Brian
Home Financials for this Owner
Home Financials are based on the most recent Mortgage that was taken out on this home.
Original Mortgage
$127,300
Interest Rate
7.25%
Create a Home Valuation Report for This Property
The Home Valuation Report is an in-depth analysis detailing your home's value as well as a comparison with similar homes in the area
Home Values in the Area
Average Home Value in this Area
Purchase History
| Date | Buyer | Sale Price | Title Company |
|---|---|---|---|
| Lynch Brian | $229,900 | Rtc | |
| Bowman Eric P | $155,000 | -- | |
| Kaelin Brian | $134,000 | -- |
Source: Public Records
Mortgage History
| Date | Status | Borrower | Loan Amount |
|---|---|---|---|
| Previous Owner | Lynch Brian | $183,900 | |
| Previous Owner | Bowman Eric P | $152,605 | |
| Previous Owner | Kaelin Brian | $127,300 |
Source: Public Records
Tax History Compared to Growth
Tax History
| Year | Tax Paid | Tax Assessment Tax Assessment Total Assessment is a certain percentage of the fair market value that is determined by local assessors to be the total taxable value of land and additions on the property. | Land | Improvement |
|---|---|---|---|---|
| 2025 | $3,397 | $416,300 | $186,200 | $230,100 |
| 2024 | $3,397 | $395,700 | $176,400 | $219,300 |
| 2023 | $3,397 | $367,600 | $168,500 | $199,100 |
| 2022 | $3,306 | $380,400 | $168,500 | $211,900 |
| 2021 | $3,191 | $263,400 | $112,500 | $150,900 |
| 2019 | $2,835 | $235,900 | $95,500 | $140,400 |
| 2018 | $2,912 | $219,900 | $83,200 | $136,700 |
| 2017 | $2,660 | $193,100 | $66,800 | $126,300 |
| 2016 | $2,448 | $157,400 | $51,800 | $105,600 |
| 2014 | $2,028 | $146,100 | $46,300 | $99,800 |
| 2013 | $2,028 | $120,800 | $36,400 | $84,400 |
Source: Public Records
Map
Nearby Homes
- 322 Orting Ave NW
- 731 Teetor Cir NW Unit LOT 14
- 726 Teetor Cir NW Unit Lot 13
- 724 Teetor Cir NW Unit LOT 12
- 718 Teetor Cir NW Unit LOT 9
- 721 Teetor Cir NW Unit Lot 19
- 721 Teetor Cir NW
- 730 Teetor Cir NW Unit LOT 31
- 503 Coe Ln SW
- 719 Teetor Cir NW Unit Lot 20
- 710 Teetor Cir NW
- 710 Teetor Cir NW Unit LOT 5
- 728 Teetor Cir NW Unit Lot 30
- 717 Teetor Cir NW Unit Lot 21
- 708 Teetor Cir NW Unit LOT 4
- 715 Teetor Cir NW Unit Lot 22
- 706 Teetor Cir NW Unit LOT 3
- 215 Corrin Ave NW Unit B
- 215 Corrin Ave NW Unit A
- 704 Teetor NW Unit LOT 2
- 611 Burnett Ct NW
- 314 Groff Ave NW
- 606 Callendar St NW
- 609 Burnett Ct NW
- 608 Callendar St NW
- 313 Groff Ave NW
- 311 Groff Ave NW
- 616 Burnett Ct NW
- 315 Groff Ave NW
- 614 Burnett Ct NW
- 604 Callendar St NW
- 309 Groff Ave NW
- 607 Burnett Ct NW
- 317 Groff Ave NW
- 307 Groff Ave NW
- 612 Burnett Ct NW
- 602 Callendar St NW
- 306 Groff Ave NW
- 605 Burnett Ct NW
- 305 Groff Ave NW