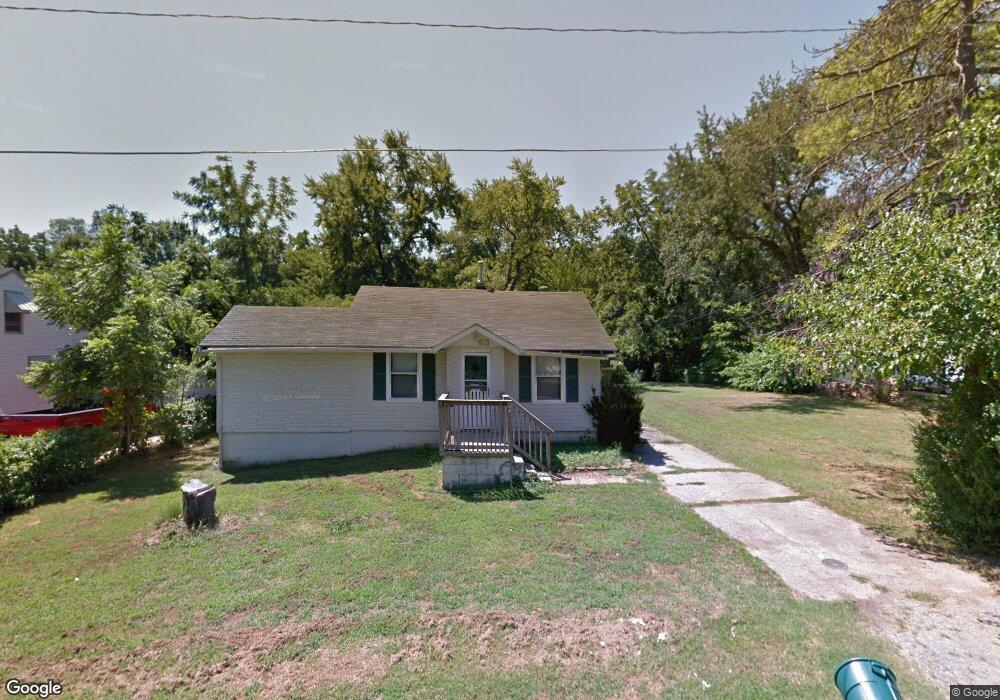
613 E Angus St Independence, MO 64055
Hanthorn NeighborhoodEstimated Value: $83,000 - $144,000
3
Beds
1
Bath
884
Sq Ft
$138/Sq Ft
Est. Value
About This Home
This home is located at 613 E Angus St, Independence, MO 64055 and is currently estimated at $121,965, approximately $137 per square foot. 613 E Angus St is a home located in Jackson County with nearby schools including Sycamore Hills Elementary School, Bridger Middle School, and Pioneer Ridge Middle School.
Ownership History
Date
Name
Owned For
Owner Type
Purchase Details
Closed on
Aug 31, 2015
Sold by
Bltrejv3 Kansas City Llc
Bought by
Csma Blt Llc
Current Estimated Value
Purchase Details
Closed on
Mar 26, 2013
Sold by
Home Remedy Investments Llc
Bought by
Bltrejv3 Kansas City Llc
Purchase Details
Closed on
Mar 15, 2013
Sold by
Federal Home Loan Mortgage Corporation
Bought by
Home Remedy Investments Llc
Purchase Details
Closed on
Nov 6, 2012
Sold by
Flagstar Bank Fsb
Bought by
Federal Home Loan Mortgage Corporation
Purchase Details
Closed on
Oct 8, 2012
Sold by
Cooke Elwin E and Cooke Donna J
Bought by
Flagstar Bank S S B
Purchase Details
Closed on
Sep 22, 2000
Sold by
Rynard Brad and Rynard Jennifer
Bought by
Cooke Elwin Euray and Cooke Donna Jean
Home Financials for this Owner
Home Financials are based on the most recent Mortgage that was taken out on this home.
Original Mortgage
$48,600
Interest Rate
7.97%
Mortgage Type
Purchase Money Mortgage
Create a Home Valuation Report for This Property
The Home Valuation Report is an in-depth analysis detailing your home's value as well as a comparison with similar homes in the area
Home Values in the Area
Average Home Value in this Area
Purchase History
| Date | Buyer | Sale Price | Title Company |
|---|---|---|---|
| Csma Blt Llc | -- | None Available | |
| Bltrejv3 Kansas City Llc | -- | None Available | |
| Home Remedy Investments Llc | -- | Stewart Title | |
| Federal Home Loan Mortgage Corporation | -- | None Available | |
| Flagstar Bank S S B | $29,000 | None Available | |
| Cooke Elwin Euray | -- | Assured Quality Title Compan |
Source: Public Records
Mortgage History
| Date | Status | Borrower | Loan Amount |
|---|---|---|---|
| Previous Owner | Cooke Elwin Euray | $48,600 |
Source: Public Records
Tax History
| Year | Tax Paid | Tax Assessment Tax Assessment Total Assessment is a certain percentage of the fair market value that is determined by local assessors to be the total taxable value of land and additions on the property. | Land | Improvement |
|---|---|---|---|---|
| 2025 | $1,052 | $7,538 | $5,514 | $2,024 |
| 2024 | $1,028 | $15,181 | $3,857 | $11,324 |
| 2023 | $1,028 | $15,181 | $1,689 | $13,492 |
| 2022 | $421 | $5,700 | $3,848 | $1,852 |
| 2021 | $421 | $5,700 | $3,848 | $1,852 |
| 2020 | $438 | $5,763 | $3,848 | $1,915 |
| 2019 | $431 | $5,763 | $3,848 | $1,915 |
| 2018 | $283 | $3,613 | $2,544 | $1,069 |
| 2016 | $279 | $3,523 | $2,544 | $979 |
Source: Public Records
Map
Nearby Homes
- 603 E Myrtle St
- 1340 S Emery Ave
- 421 E Angus St
- 735 E Devon St
- 1339 S Hocker Ave
- 718 E Gudgell Ave
- 1312 S Pearl St
- 1402 S Dodgion Ave
- 1120 S Leslie St
- 660 E Red Rd
- 921 E Manor Rd
- 912 E Stone St
- 930 S Leslie St
- 925 S Emery St
- 914 E South Ave
- 1040 E Stone St
- 913 S Hocker Ave
- 903 S Pope Ave
- 1100 S Noland Rd
- 212 E Hansen Ct Unit 1
- 607 E Angus St
- 615 E Angus St
- 608 E Angus St
- 606 E Angus St
- 616 E Angus St
- 601 E Angus St
- 610 E Hereford Ave
- 604 E Angus St
- 618 E Angus St
- 614 E Angus St
- 617 E Angus St
- 608 E Hereford Ave
- 619 E Angus St
- 620 E Angus St
- 604 E Hereford Ave
- 612 E Hereford Ave
- 602 E Angus St
- 618 E Hereford Ave
- 607 E Aberdeen St
- 600 E Hereford Ave
Your Personal Tour Guide
Ask me questions while you tour the home.