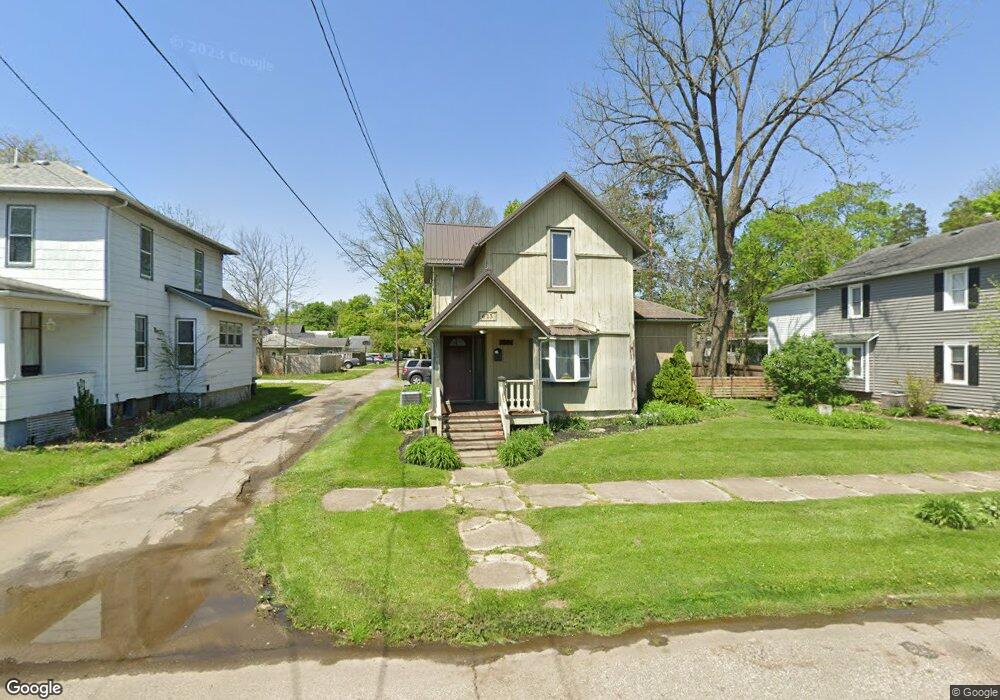
613 E Chestnut St Mount Vernon, OH 43050
Estimated Value: $232,254 - $262,000
4
Beds
2
Baths
1,808
Sq Ft
$134/Sq Ft
Est. Value
About This Home
This home is located at 613 E Chestnut St, Mount Vernon, OH 43050 and is currently estimated at $242,314, approximately $134 per square foot. 613 E Chestnut St is a home located in Knox County with nearby schools including Mount Vernon High School, St. Vincent de Paul School, and Christian Star Academy.
Ownership History
Date
Name
Owned For
Owner Type
Purchase Details
Closed on
Apr 12, 2018
Bought by
Croswell Conor
Current Estimated Value
Home Financials for this Owner
Home Financials are based on the most recent Mortgage that was taken out on this home.
Original Mortgage
$95,036
Outstanding Balance
$81,691
Interest Rate
4.42%
Estimated Equity
$160,623
Purchase Details
Closed on
May 29, 1996
Sold by
Snow Michael B
Bought by
Croswell Frank and Croswell Annmarie
Create a Home Valuation Report for This Property
The Home Valuation Report is an in-depth analysis detailing your home's value as well as a comparison with similar homes in the area
Home Values in the Area
Average Home Value in this Area
Purchase History
| Date | Buyer | Sale Price | Title Company |
|---|---|---|---|
| Croswell Conor | -- | -- | |
| Croswell Frank | $65,500 | -- |
Source: Public Records
Mortgage History
| Date | Status | Borrower | Loan Amount |
|---|---|---|---|
| Open | Croswell Conor | $95,036 | |
| Closed | Croswell Conor | -- |
Source: Public Records
Tax History
| Year | Tax Paid | Tax Assessment Tax Assessment Total Assessment is a certain percentage of the fair market value that is determined by local assessors to be the total taxable value of land and additions on the property. | Land | Improvement |
|---|---|---|---|---|
| 2024 | $1,954 | $51,660 | $10,440 | $41,220 |
| 2023 | $1,998 | $51,660 | $10,440 | $41,220 |
| 2022 | $1,757 | $41,330 | $8,350 | $32,980 |
| 2021 | $1,757 | $41,330 | $8,350 | $32,980 |
| 2020 | $1,712 | $41,330 | $8,350 | $32,980 |
| 2019 | $1,636 | $36,850 | $11,280 | $25,570 |
| 2018 | $1,636 | $36,850 | $11,280 | $25,570 |
| 2017 | $1,607 | $36,850 | $11,280 | $25,570 |
| 2016 | $1,490 | $34,110 | $10,440 | $23,670 |
| 2015 | $1,497 | $34,110 | $10,440 | $23,670 |
| 2014 | $1,504 | $34,110 | $10,440 | $23,670 |
| 2013 | $1,585 | $34,210 | $10,850 | $23,360 |
Source: Public Records
Map
Nearby Homes
- 600 1/2 E Chestnut St
- 600 E Chestnut St Unit 1/2
- 108 Ringold St
- 220 Coshocton Ave
- 213 Coshocton Ave
- 501 Oak St
- 418 E Pleasant St
- 419 E Pleasant St
- 604 E Gambier St
- 655 Howard St
- 104 N Park St
- 900 E Gambier St
- 1 Hilltop Dr
- 0 Miami St
- 612 N Clinton St
- 208 E Burgess St
- 6 Edgewood Blvd
- 13 Eastgate Dr
- 12 3rd Ave
- 12 Third Ave
Your Personal Tour Guide
Ask me questions while you tour the home.