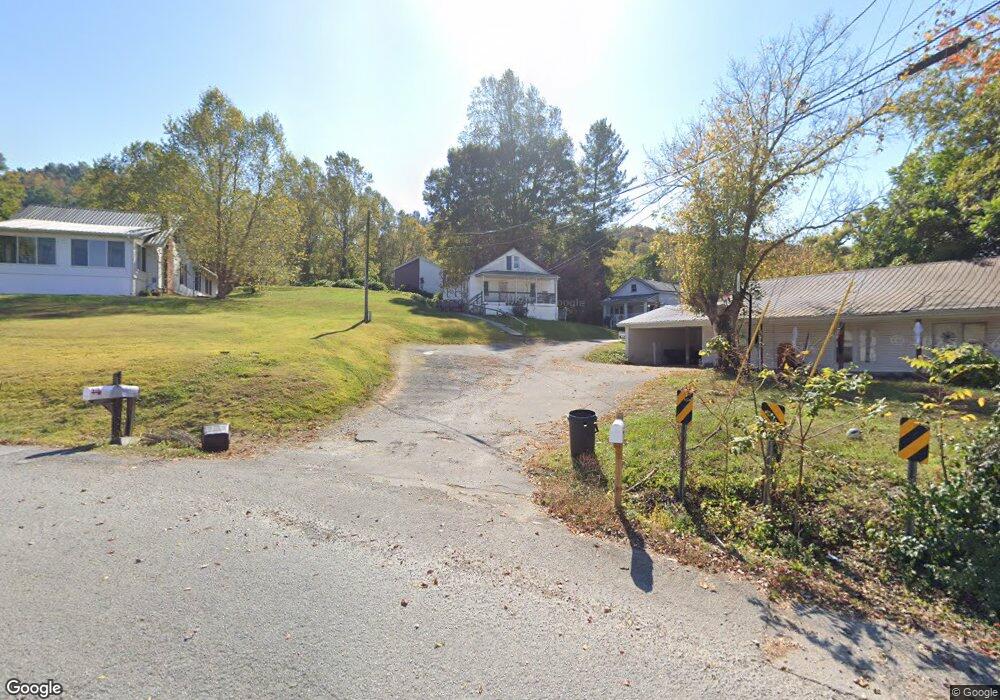
613 Evans St Unit 615 Livingston, TN 38570
Estimated Value: $155,000 - $204,000
--
Bed
1
Bath
676
Sq Ft
$266/Sq Ft
Est. Value
About This Home
This home is located at 613 Evans St Unit 615, Livingston, TN 38570 and is currently estimated at $180,000, approximately $266 per square foot. 613 Evans St Unit 615 is a home located in Overton County.
Ownership History
Date
Name
Owned For
Owner Type
Purchase Details
Closed on
Oct 17, 2023
Sold by
A & M Investment
Bought by
Am Investments Tn Llc
Current Estimated Value
Home Financials for this Owner
Home Financials are based on the most recent Mortgage that was taken out on this home.
Original Mortgage
$285,609
Outstanding Balance
$280,067
Interest Rate
7.19%
Mortgage Type
New Conventional
Estimated Equity
-$100,067
Purchase Details
Closed on
Mar 23, 2021
Sold by
Richardson Denise and Richardson Danny
Bought by
Am Investments
Purchase Details
Closed on
Jun 11, 2003
Bought by
Richardson Denise Worley
Purchase Details
Closed on
May 13, 1988
Bought by
Worley John and Worley Nadine
Purchase Details
Closed on
Mar 16, 1987
Bought by
Worley John and Worley Nadine
Purchase Details
Closed on
Mar 3, 1986
Purchase Details
Closed on
Mar 16, 1984
Create a Home Valuation Report for This Property
The Home Valuation Report is an in-depth analysis detailing your home's value as well as a comparison with similar homes in the area
Home Values in the Area
Average Home Value in this Area
Purchase History
| Date | Buyer | Sale Price | Title Company |
|---|---|---|---|
| Am Investments Tn Llc | -- | None Listed On Document | |
| Am Investments | $150,000 | None Available | |
| Richardson Denise Worley | $95,000 | -- | |
| Worley John | $9,000 | -- | |
| Worley John | -- | -- | |
| -- | -- | -- | |
| -- | -- | -- |
Source: Public Records
Mortgage History
| Date | Status | Borrower | Loan Amount |
|---|---|---|---|
| Open | Am Investments Tn Llc | $285,609 |
Source: Public Records
Tax History Compared to Growth
Tax History
| Year | Tax Paid | Tax Assessment Tax Assessment Total Assessment is a certain percentage of the fair market value that is determined by local assessors to be the total taxable value of land and additions on the property. | Land | Improvement |
|---|---|---|---|---|
| 2024 | $1,191 | $29,350 | $2,000 | $27,350 |
| 2023 | $1,083 | $29,350 | $2,000 | $27,350 |
| 2022 | $1,051 | $29,350 | $2,000 | $27,350 |
| 2021 | $1,036 | $29,350 | $2,000 | $27,350 |
| 2020 | $1,021 | $29,350 | $2,000 | $27,350 |
| 2019 | $669 | $18,075 | $2,000 | $16,075 |
| 2018 | $584 | $18,075 | $2,000 | $16,075 |
| 2017 | $584 | $15,775 | $2,000 | $13,775 |
| 2016 | $584 | $15,775 | $2,000 | $13,775 |
| 2015 | $513 | $15,775 | $2,000 | $13,775 |
| 2014 | -- | $15,775 | $2,000 | $13,775 |
| 2013 | -- | $15,400 | $0 | $0 |
Source: Public Records
Map
Nearby Homes