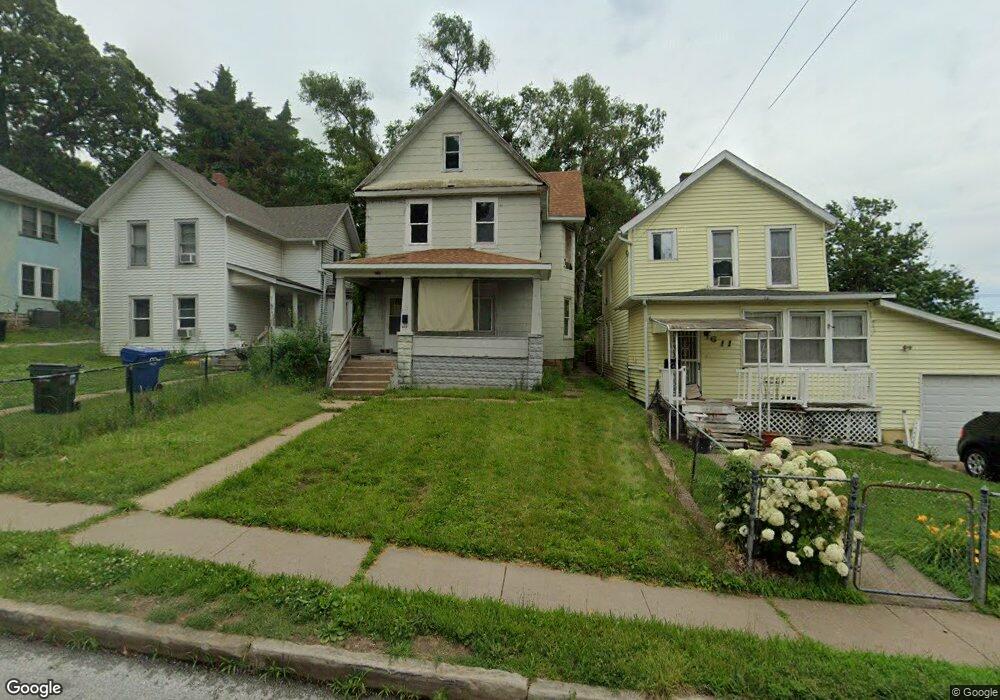
613 Farnam St Davenport, IA 52803
Central Davenport NeighborhoodEstimated Value: $99,235 - $140,000
4
Beds
2
Baths
2,359
Sq Ft
$50/Sq Ft
Est. Value
About This Home
This home is located at 613 Farnam St, Davenport, IA 52803 and is currently estimated at $117,559, approximately $49 per square foot. 613 Farnam St is a home located in Scott County with nearby schools including Madison Elementary School, Frank L. Smart Intermediate School, and Central High School.
Ownership History
Date
Name
Owned For
Owner Type
Purchase Details
Closed on
Jun 15, 2018
Sold by
Vega Jorge and Vega Monica
Bought by
Birerman Mark
Current Estimated Value
Purchase Details
Closed on
Jun 5, 2018
Sold by
Harby Minnie P and Lathan Minnie P
Bought by
Vega Jor
Purchase Details
Closed on
Aug 28, 2014
Sold by
Granado Emmett James
Bought by
Vega Jorge A
Purchase Details
Closed on
Jun 30, 1993
Sold by
Lathan Johnnie
Bought by
Lowery Clifford
Create a Home Valuation Report for This Property
The Home Valuation Report is an in-depth analysis detailing your home's value as well as a comparison with similar homes in the area
Home Values in the Area
Average Home Value in this Area
Purchase History
| Date | Buyer | Sale Price | Title Company |
|---|---|---|---|
| Birerman Mark | -- | -- | |
| Vega Jor | -- | -- | |
| Vega Jorge A | -- | None Available | |
| Lowery Clifford | $10,000 | None Available |
Source: Public Records
Tax History Compared to Growth
Tax History
| Year | Tax Paid | Tax Assessment Tax Assessment Total Assessment is a certain percentage of the fair market value that is determined by local assessors to be the total taxable value of land and additions on the property. | Land | Improvement |
|---|---|---|---|---|
| 2025 | $998 | $59,000 | $11,200 | $47,800 |
| 2024 | $974 | $55,820 | $11,200 | $44,620 |
| 2023 | $1,541 | $55,820 | $11,200 | $44,620 |
| 2022 | $1,604 | $34,080 | $5,120 | $28,960 |
| 2021 | $634 | $29,560 | $5,120 | $24,440 |
| 2020 | $1,205 | $31,310 | $5,120 | $26,190 |
| 2019 | $1,093 | $31,260 | $5,120 | $26,140 |
| 2018 | $250 | $31,260 | $5,120 | $26,140 |
| 2017 | $174 | $31,260 | $5,120 | $26,140 |
| 2016 | $961 | $31,260 | $0 | $0 |
| 2015 | $684 | $34,830 | $0 | $0 |
| 2014 | $774 | $34,830 | $0 | $0 |
| 2013 | $760 | $0 | $0 | $0 |
| 2012 | -- | $42,630 | $4,080 | $38,550 |
Source: Public Records
Map
Nearby Homes