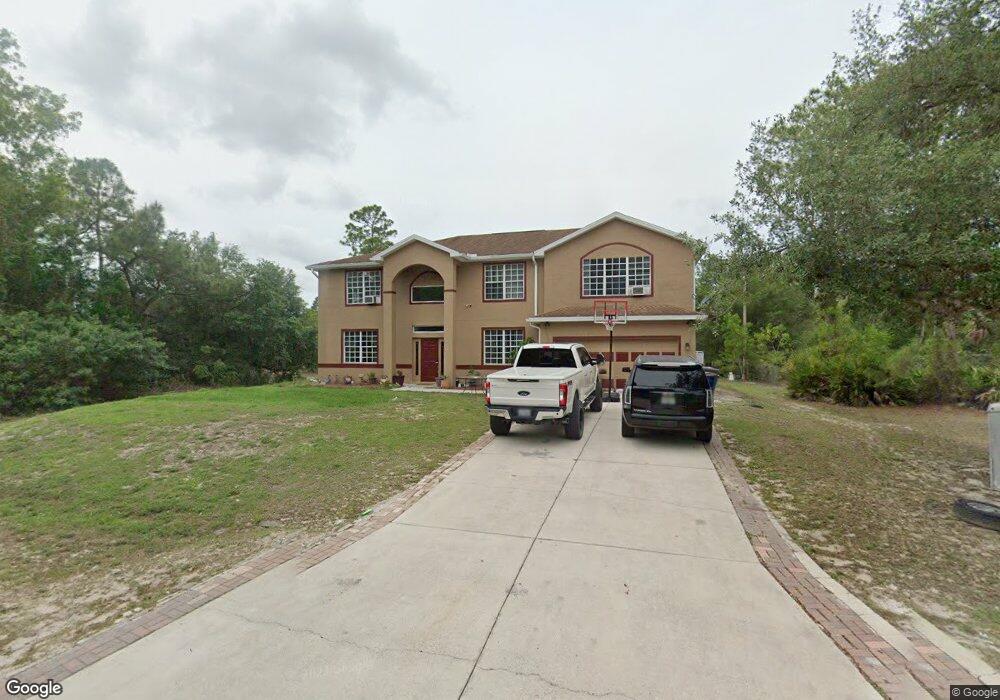
613 Glenn Ave Unit 8 Lehigh Acres, FL 33972
Joel NeighborhoodEstimated Value: $427,405 - $511,000
5
Beds
3
Baths
3,543
Sq Ft
$136/Sq Ft
Est. Value
About This Home
This home is located at 613 Glenn Ave Unit 8, Lehigh Acres, FL 33972 and is currently estimated at $482,101, approximately $136 per square foot. 613 Glenn Ave Unit 8 is a home located in Lee County with nearby schools including Lehigh Elementary School, The Alva School, and Gateway Elementary School.
Ownership History
Date
Name
Owned For
Owner Type
Purchase Details
Closed on
Sep 1, 2020
Sold by
Ramdeholl Jamwant
Bought by
Alva Eloy Palacios and Sanchez Maria Mercedes
Current Estimated Value
Purchase Details
Closed on
Sep 2, 2016
Sold by
Ramdeholl Jamwant
Bought by
Palacios Eloy and Sanchez Maria Merced Cuevas
Purchase Details
Closed on
Jun 27, 2007
Sold by
Mw Johnson Construction Of Florida Inc
Bought by
Ramdeholl Jamwant
Purchase Details
Closed on
Apr 15, 2005
Sold by
Ramdeholl Jamwant
Bought by
M W Johnson Construction Of Florida Inc
Purchase Details
Closed on
Jan 24, 2005
Sold by
Benbassat Diego
Bought by
Ramdeholl Jamwant
Purchase Details
Closed on
May 14, 2004
Sold by
Thompson Tommie and Thompson Janice A
Bought by
Benbassat Diego
Purchase Details
Closed on
May 3, 2003
Sold by
Thompson Tommie and Thompson Janice A
Bought by
Thompson Tommie
Create a Home Valuation Report for This Property
The Home Valuation Report is an in-depth analysis detailing your home's value as well as a comparison with similar homes in the area
Home Values in the Area
Average Home Value in this Area
Purchase History
| Date | Buyer | Sale Price | Title Company |
|---|---|---|---|
| Alva Eloy Palacios | $100 | Experienced Title & Escrow | |
| Palacios Eloy | $289,000 | None Available | |
| Ramdeholl Jamwant | $226,800 | Title Group Fort Myers Ltd | |
| M W Johnson Construction Of Florida Inc | -- | -- | |
| Ramdeholl Jamwant | $30,000 | Tradewinds Title Inc | |
| Benbassat Diego | $17,000 | Tradewinds Title Inc | |
| Thompson Tommie | -- | -- |
Source: Public Records
Tax History Compared to Growth
Tax History
| Year | Tax Paid | Tax Assessment Tax Assessment Total Assessment is a certain percentage of the fair market value that is determined by local assessors to be the total taxable value of land and additions on the property. | Land | Improvement |
|---|---|---|---|---|
| 2025 | $5,057 | $306,376 | $24,225 | $277,872 |
| 2024 | $5,057 | $343,986 | $21,776 | $317,325 |
| 2023 | $5,126 | $322,953 | $0 | $0 |
| 2022 | $4,801 | $293,594 | $0 | $0 |
| 2021 | $4,044 | $266,904 | $7,500 | $259,404 |
| 2020 | $3,917 | $250,343 | $6,600 | $243,743 |
| 2019 | $3,747 | $239,825 | $6,600 | $233,225 |
| 2018 | $3,492 | $217,222 | $6,200 | $211,022 |
| 2017 | $3,562 | $218,829 | $5,100 | $213,729 |
| 2016 | $2,670 | $174,516 | $5,100 | $169,416 |
| 2015 | $2,418 | $149,004 | $4,440 | $144,564 |
| 2014 | $2,474 | $158,803 | $3,000 | $155,803 |
| 2013 | -- | $113,221 | $3,600 | $109,621 |
Source: Public Records
Map
Nearby Homes
- 1701 E 6th St
- 618 Sheldon Ave
- 703 Sheldon Ave
- 703 E 6th St
- 605 Broadway Ave
- 516 Dayton Ave
- 703 Michael Ave Unit 14
- 1504 E 6th St
- 709 Michael Ave
- 515 Broadway Ave
- 506 E 7th St
- 3604 E 7th St
- 507 Dayton Ave
- 1401 E 7th St
- 613 Gerald Ave
- 609 Gerald Ave
- 603 Washington Ave
- 606 Gerald Ave Unit 111
- 606 Gerald Ave Unit 112
- 608 Gerald Ave Unit 214
- 612 Dayton Ave
- 609 Glenn Ave
- 610 Dayton Ave
- 612 Glenn Ave
- 614 Glenn Ave Unit 8
- 619 Glenn Ave
- 607 Glenn Ave
- 608 Glenn Ave
- 616 Glenn Ave
- 618 Dayton Ave
- 606 Dayton Ave
- 618 Glenn Ave
- 604 Dayton Ave
- 615 Dayton Ave
- 615 Sheldon Ave
- 1702 E 7th St
- 609 Sheldon Ave
- 623 Glenn Ave Unit 8
- 1700 E 7th St
- 619 Dayton Ave