Estimated Value: $347,000 - $413,000
4
Beds
3
Baths
2,100
Sq Ft
$182/Sq Ft
Est. Value
About This Home
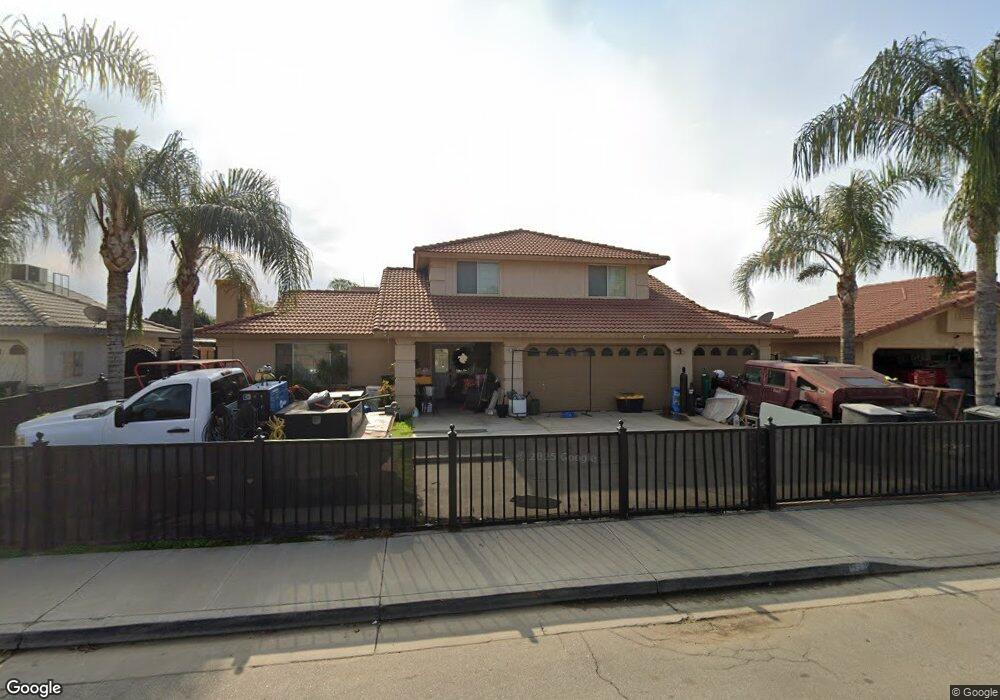
This home is located at 613 Jess St, Arvin, CA 93203 and is currently estimated at $382,351, approximately $182 per square foot. 613 Jess St is a home located in Kern County with nearby schools including El Camino Real Elementary School, Haven Drive Middle School, and Arvin High School.
Ownership History
Date
Name
Owned For
Owner Type
Purchase Details
Closed on
Apr 14, 2009
Sold by
Melgar Luis M and Melgar Patricia M
Bought by
Gomez Tomas and Gomez Guadalupe
Current Estimated Value
Home Financials for this Owner
Home Financials are based on the most recent Mortgage that was taken out on this home.
Original Mortgage
$157,003
Outstanding Balance
$100,471
Interest Rate
5.17%
Mortgage Type
FHA
Estimated Equity
$281,881
Purchase Details
Closed on
Oct 18, 2004
Sold by
Arambula Jose and Arambula Rosalba
Bought by
Melgar Luis M and Melgar Patricia M
Home Financials for this Owner
Home Financials are based on the most recent Mortgage that was taken out on this home.
Original Mortgage
$156,000
Interest Rate
5.6%
Mortgage Type
Purchase Money Mortgage
Purchase Details
Closed on
Nov 25, 2002
Sold by
Parade
Bought by
Arambula Jose and Arambula Rosalba
Home Financials for this Owner
Home Financials are based on the most recent Mortgage that was taken out on this home.
Original Mortgage
$131,978
Interest Rate
5.54%
Mortgage Type
FHA
Create a Home Valuation Report for This Property
The Home Valuation Report is an in-depth analysis detailing your home's value as well as a comparison with similar homes in the area
Home Values in the Area
Average Home Value in this Area
Purchase History
| Date | Buyer | Sale Price | Title Company |
|---|---|---|---|
| Gomez Tomas | $160,000 | Chicago Title Company | |
| Melgar Luis M | $160,000 | Fidelity Title | |
| Arambula Jose | $135,500 | Fidelity Title |
Source: Public Records
Mortgage History
| Date | Status | Borrower | Loan Amount |
|---|---|---|---|
| Open | Gomez Tomas | $157,003 | |
| Previous Owner | Melgar Luis M | $156,000 | |
| Previous Owner | Arambula Jose | $131,978 |
Source: Public Records
Tax History
| Year | Tax Paid | Tax Assessment Tax Assessment Total Assessment is a certain percentage of the fair market value that is determined by local assessors to be the total taxable value of land and additions on the property. | Land | Improvement |
|---|---|---|---|---|
| 2025 | $3,481 | $206,021 | $57,939 | $148,082 |
| 2024 | $3,349 | $201,982 | $56,803 | $145,179 |
| 2023 | $3,349 | $198,023 | $55,690 | $142,333 |
| 2022 | $3,285 | $194,142 | $54,599 | $139,543 |
| 2021 | $3,166 | $190,336 | $53,529 | $136,807 |
| 2020 | $3,122 | $188,386 | $52,981 | $135,405 |
| 2019 | $3,082 | $188,386 | $52,981 | $135,405 |
| 2018 | $2,991 | $181,073 | $50,925 | $130,148 |
| 2017 | $2,914 | $177,524 | $49,927 | $127,597 |
| 2016 | $2,760 | $174,045 | $48,949 | $125,096 |
| 2015 | $2,677 | $171,431 | $48,214 | $123,217 |
| 2014 | $2,555 | $163,000 | $41,000 | $122,000 |
Source: Public Records
Map
Nearby Homes
- 1708 Payne Dr
- 201 Gonzales St
- 1836 Walnut Dr
- 1316 Tesoro Dr
- 801 Schipper St Unit 20
- 801 Schipper St Unit 65
- 801 Schipper St Unit 86
- 801 Schipper St Unit 33
- 801 Schipper St Unit 68
- 801 Schipper St Unit 60
- 801 Schipper St Unit 31
- 801 Schipper St Unit 46
- 931 S Derby St
- 828 Stockton Ave
- 776 Butte Ave
- 140 Langford Ave
- 1200 Royal St
- 1777 S Comanche Dr
- 0 S Comanche Dr
- 3501 Blue Loop Ln
Your Personal Tour Guide
Ask me questions while you tour the home.