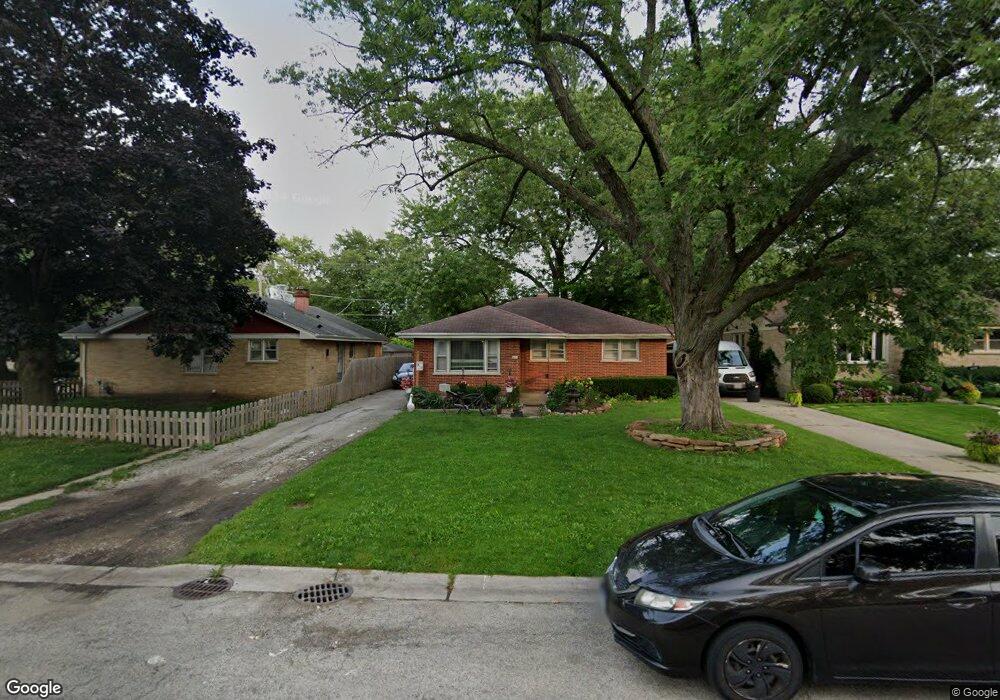
613 Mckinley Ave Mundelein, IL 60060
Estimated Value: $268,483 - $346,000
--
Bed
1
Bath
1,022
Sq Ft
$283/Sq Ft
Est. Value
About This Home
This home is located at 613 Mckinley Ave, Mundelein, IL 60060 and is currently estimated at $289,371, approximately $283 per square foot. 613 Mckinley Ave is a home located in Lake County with nearby schools including Washington Early Learning Center, Mechanics Grove Elementary School, and Carl Sandburg Middle School.
Ownership History
Date
Name
Owned For
Owner Type
Purchase Details
Closed on
Feb 16, 2016
Sold by
Muntz David and Muntz Jean Ann
Bought by
Djak Properties Llc 613 East Mckinley Se
Current Estimated Value
Purchase Details
Closed on
Jun 5, 2002
Sold by
Washington Mutual Bank Fa
Bought by
Munoz David
Home Financials for this Owner
Home Financials are based on the most recent Mortgage that was taken out on this home.
Original Mortgage
$119,601
Interest Rate
5.9%
Mortgage Type
Negative Amortization
Purchase Details
Closed on
Dec 19, 2001
Sold by
Sandoval
Bought by
Washington Mutual Bank Fa and Bank United
Purchase Details
Closed on
Apr 20, 2000
Sold by
Nicholson Dwight G and Nicholson Julie M
Bought by
Sandoval Audencio and Figueroa Francisco
Home Financials for this Owner
Home Financials are based on the most recent Mortgage that was taken out on this home.
Original Mortgage
$152,966
Interest Rate
8.18%
Create a Home Valuation Report for This Property
The Home Valuation Report is an in-depth analysis detailing your home's value as well as a comparison with similar homes in the area
Home Values in the Area
Average Home Value in this Area
Purchase History
| Date | Buyer | Sale Price | Title Company |
|---|---|---|---|
| Djak Properties Llc 613 East Mckinley Se | -- | Attorney | |
| Munoz David | $150,000 | Chicago Title Insurance Co | |
| Washington Mutual Bank Fa | -- | -- | |
| Sandoval Audencio | $154,000 | Collar Counties Title |
Source: Public Records
Mortgage History
| Date | Status | Borrower | Loan Amount |
|---|---|---|---|
| Previous Owner | Munoz David | $119,601 | |
| Previous Owner | Sandoval Audencio | $152,966 |
Source: Public Records
Tax History Compared to Growth
Tax History
| Year | Tax Paid | Tax Assessment Tax Assessment Total Assessment is a certain percentage of the fair market value that is determined by local assessors to be the total taxable value of land and additions on the property. | Land | Improvement |
|---|---|---|---|---|
| 2024 | $7,482 | $77,183 | $18,741 | $58,442 |
| 2023 | $6,729 | $71,189 | $17,286 | $53,903 |
| 2022 | $6,729 | $63,223 | $16,614 | $46,609 |
| 2021 | $6,543 | $61,862 | $16,256 | $45,606 |
| 2020 | $6,206 | $57,926 | $15,222 | $42,704 |
| 2019 | $6,158 | $57,375 | $15,077 | $42,298 |
| 2018 | $5,094 | $47,330 | $15,235 | $32,095 |
| 2017 | $5,073 | $45,836 | $14,754 | $31,082 |
| 2016 | $4,916 | $43,459 | $13,989 | $29,470 |
| 2015 | $4,803 | $40,620 | $13,075 | $27,545 |
| 2014 | $5,281 | $40,075 | $12,900 | $27,175 |
| 2012 | $5,104 | $45,936 | $14,787 | $31,149 |
Source: Public Records
Map
Nearby Homes
- 422 James Ave
- 328 Brice Ave
- 841 Wilcox St
- 659 E Maple Ave
- 331 Plaza Cir
- 847 Mckinley Ave
- 215 Brice Ave
- 701 Thomas Ct
- 49 N Shaddle Ave
- 29746 U S 45
- 40 S Seymour Ave
- 288 N Lincoln Ave
- 510 S Hickory St
- 137 Racine Place
- 742 N Lake St
- 31 Washington Blvd Unit 108
- 433 E High St
- 116 N Prairie Ave
- 1255 Huntington Dr
- 114 W Hawthorne Blvd
- 617 Mckinley Ave
- 609 Mckinley Ave
- 310 Prospect Ave
- 605 Mckinley Ave
- 250 Anthony Ave Unit 2080
- 250 Anthony Ave Unit 304
- 250 Anthony Ave Unit 602
- 250 Anthony Ave Unit 318
- 250 Anthony Ave Unit 512
- 250 Anthony Ave Unit 510
- 250 Anthony Ave Unit 207
- 250 Anthony Ave Unit 208
- 250 Anthony Ave Unit 217
- 250 Anthony Ave Unit 204
- 250 Anthony Ave Unit 219
- 250 Anthony Ave Unit 212
- 250 Anthony Ave Unit 214
- 250 Anthony Ave Unit 209
- 0 Prospect Ave Unit 8497858
- 0 Prospect Ave Unit 9295894