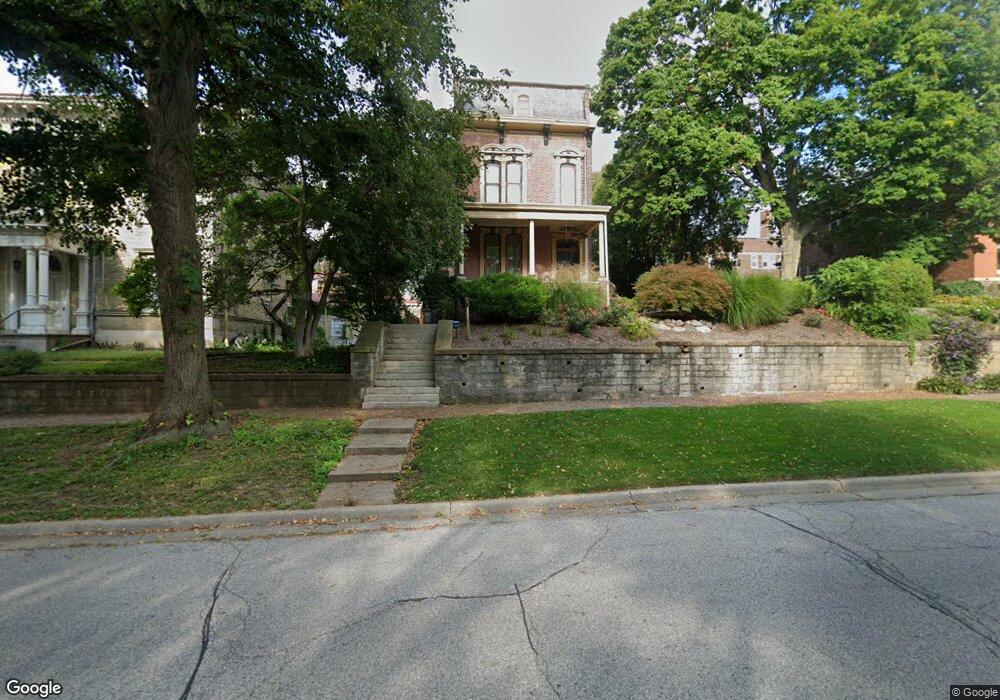
613 N 5th St Burlington, IA 52601
Estimated Value: $200,000 - $280,804
5
Beds
4
Baths
3,021
Sq Ft
$85/Sq Ft
Est. Value
About This Home
This home is located at 613 N 5th St, Burlington, IA 52601 and is currently estimated at $256,951, approximately $85 per square foot. 613 N 5th St is a home located in Des Moines County with nearby schools including Burlington Community High School, Great River Christian School, and Burlington Christian School.
Ownership History
Date
Name
Owned For
Owner Type
Purchase Details
Closed on
Apr 30, 2021
Sold by
Christ Episcopal Church Of Burlington
Bought by
Heritage Hill Partners
Current Estimated Value
Purchase Details
Closed on
Oct 21, 2011
Sold by
Wittkamp Kevin C and Wittkamp Stacia D
Bought by
Shinn Matthew D and Shinn Dawn M
Home Financials for this Owner
Home Financials are based on the most recent Mortgage that was taken out on this home.
Original Mortgage
$171,000
Interest Rate
4.12%
Mortgage Type
New Conventional
Purchase Details
Closed on
Jul 29, 2010
Sold by
Wittkamp Colleen A
Bought by
Wittkamp Kevin C
Purchase Details
Closed on
Mar 13, 2007
Sold by
Smith Robin and Vaccaro Robin
Bought by
Vaccaro Alfonso R
Create a Home Valuation Report for This Property
The Home Valuation Report is an in-depth analysis detailing your home's value as well as a comparison with similar homes in the area
Home Values in the Area
Average Home Value in this Area
Purchase History
| Date | Buyer | Sale Price | Title Company |
|---|---|---|---|
| Heritage Hill Partners | $340,000 | None Available | |
| Shinn Matthew D | $180,000 | None Available | |
| Wittkamp Kevin C | -- | -- | |
| Vaccaro Alfonso R | -- | None Available |
Source: Public Records
Mortgage History
| Date | Status | Borrower | Loan Amount |
|---|---|---|---|
| Previous Owner | Shinn Matthew D | $171,000 |
Source: Public Records
Tax History Compared to Growth
Tax History
| Year | Tax Paid | Tax Assessment Tax Assessment Total Assessment is a certain percentage of the fair market value that is determined by local assessors to be the total taxable value of land and additions on the property. | Land | Improvement |
|---|---|---|---|---|
| 2025 | $4,732 | $292,000 | $16,400 | $275,600 |
| 2024 | $4,732 | $253,800 | $16,400 | $237,400 |
| 2023 | $4,130 | $253,800 | $16,400 | $237,400 |
| 2022 | $3,832 | $197,200 | $16,400 | $180,800 |
| 2021 | $3,832 | $197,200 | $16,400 | $180,800 |
| 2020 | $4,088 | $197,200 | $16,400 | $180,800 |
| 2019 | $3,188 | $197,200 | $16,400 | $180,800 |
| 2018 | $3,190 | $147,100 | $15,800 | $131,300 |
| 2017 | $3,112 | $140,600 | $0 | $0 |
| 2016 | $3,002 | $140,600 | $0 | $0 |
| 2015 | $3,002 | $140,600 | $0 | $0 |
| 2014 | $3,042 | $143,700 | $0 | $0 |
Source: Public Records
Map
Nearby Homes