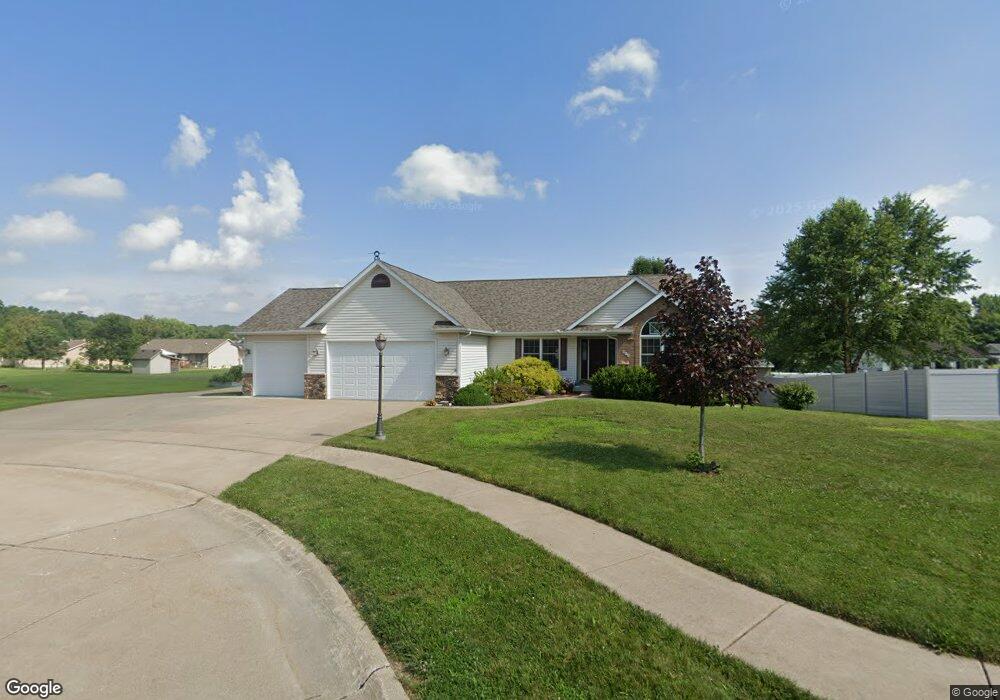
613 N 6th St Cir Princeton, IA 52768
Estimated Value: $431,000 - $464,000
4
Beds
6
Baths
1,752
Sq Ft
$257/Sq Ft
Est. Value
About This Home
This home is located at 613 N 6th St Cir, Princeton, IA 52768 and is currently estimated at $450,604, approximately $257 per square foot. 613 N 6th St Cir is a home located in Scott County with nearby schools including Virgil Grissom Elementary School, North Scott Junior High School, and North Scott Senior High School.
Ownership History
Date
Name
Owned For
Owner Type
Purchase Details
Closed on
Feb 29, 2016
Sold by
Estill Kary M
Bought by
Carter Christopher and Carter Kaitlyn
Current Estimated Value
Home Financials for this Owner
Home Financials are based on the most recent Mortgage that was taken out on this home.
Original Mortgage
$275,742
Outstanding Balance
$216,831
Interest Rate
3.62%
Estimated Equity
$233,773
Purchase Details
Closed on
Sep 13, 2010
Sold by
Starmark Custom Homes Inc
Bought by
Estill Kary M
Home Financials for this Owner
Home Financials are based on the most recent Mortgage that was taken out on this home.
Original Mortgage
$267,250
Interest Rate
4.5%
Mortgage Type
FHA
Purchase Details
Closed on
Nov 13, 2009
Sold by
Lost Grove Development Llc
Bought by
Starmark Custom Homes Inc and Robert J Schroeder Construction Inc
Create a Home Valuation Report for This Property
The Home Valuation Report is an in-depth analysis detailing your home's value as well as a comparison with similar homes in the area
Home Values in the Area
Average Home Value in this Area
Purchase History
| Date | Buyer | Sale Price | Title Company |
|---|---|---|---|
| Carter Christopher | -- | -- | |
| Estill Kary M | $271,000 | None Available | |
| Starmark Custom Homes Inc | -- | None Available |
Source: Public Records
Mortgage History
| Date | Status | Borrower | Loan Amount |
|---|---|---|---|
| Open | Carter Christopher | $275,742 | |
| Closed | Carter Christopher | -- | |
| Previous Owner | Estill Kary M | $267,250 |
Source: Public Records
Tax History Compared to Growth
Tax History
| Year | Tax Paid | Tax Assessment Tax Assessment Total Assessment is a certain percentage of the fair market value that is determined by local assessors to be the total taxable value of land and additions on the property. | Land | Improvement |
|---|---|---|---|---|
| 2025 | $5,308 | $413,900 | $45,000 | $368,900 |
| 2024 | $4,794 | $380,000 | $45,000 | $335,000 |
| 2023 | $4,714 | $380,000 | $45,000 | $335,000 |
| 2022 | $4,970 | $320,860 | $35,000 | $285,860 |
| 2021 | $4,970 | $320,860 | $35,000 | $285,860 |
| 2020 | $4,676 | $284,590 | $35,000 | $249,590 |
| 2019 | $4,688 | $279,590 | $35,000 | $244,590 |
| 2018 | $4,834 | $279,590 | $35,000 | $244,590 |
| 2017 | $1,555 | $279,590 | $35,000 | $244,590 |
| 2016 | $4,426 | $0 | $0 | $0 |
| 2015 | $4,426 | $0 | $0 | $0 |
| 2014 | $4,284 | $0 | $0 | $0 |
| 2013 | $4,214 | $0 | $0 | $0 |
| 2012 | -- | $251,950 | $35,000 | $216,950 |
Source: Public Records
Map
Nearby Homes
- 1005 2nd St
- 1023 2nd St
- 1502 Highway 67
- 110 8th St S
- 104 Illinois 84
- Lot 25 238th St
- 28055 238th St
- 16808 River Rd N
- 18312 River Rd N
- 27998 229th St
- 28009 230th St
- 22799 Great River Rd
- 26805 255th Ave
- 11816 N 84 Hwy
- 28176 226th St
- 22206 280th Ave
- 21116 River Rd N
- Lot 3 Lakeside Dr
- Lot 4 Lakeside Dr
- 27841 Bowker Dr
- 613 N 6th Street Cir
- 617 N 6th St Cir
- 609 N 6th St Cir
- 617 N 6th Street Cir
- 610 N 6th Street Cir
- 605 N 6th Street Cir
- 621 N 6th St
- 621 N 6th St Cir
- 605 N 6th St Cir
- 614 N 6th Street Cir
- 621 N 6th St Cir
- 621 N 6th Street Cir
- 614 N 6th St Cir
- 614 N 6th St
- 610 N 6th St Cir
- 610 N 6th St
- 606 N 6th St Cir
- 618 N 6th St Cir
- 606 N 6th St Cir
- 606 N 6th St