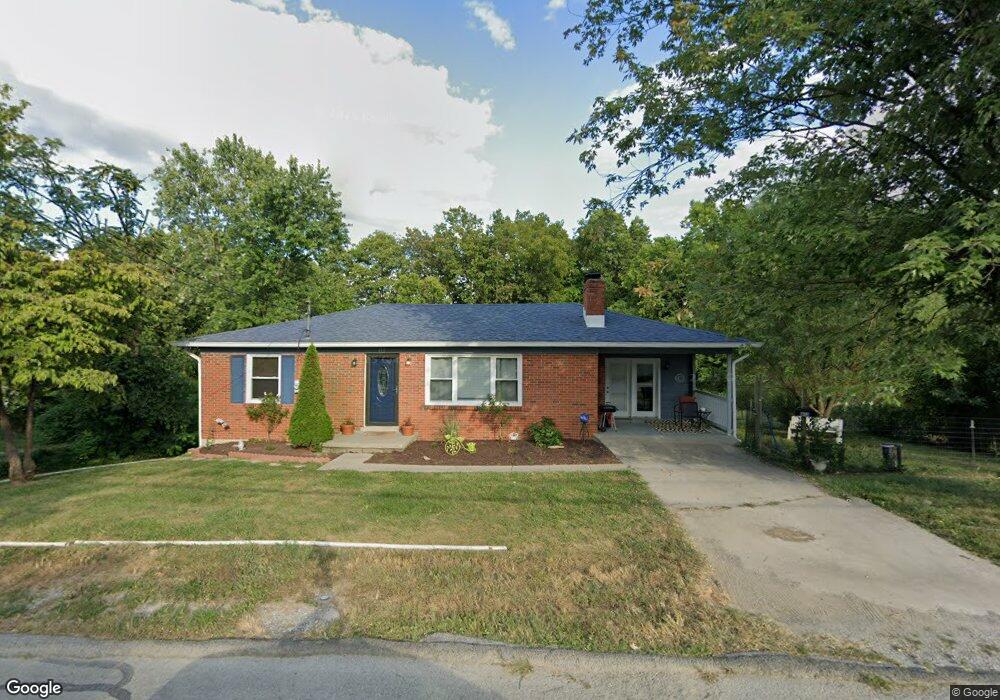
613 N Main St Unit 1 Winchester, KY 40391
Estimated Value: $171,000 - $240,437
2
Beds
1
Bath
2,050
Sq Ft
$98/Sq Ft
Est. Value
About This Home
This home is located at 613 N Main St Unit 1, Winchester, KY 40391 and is currently estimated at $201,109, approximately $98 per square foot. 613 N Main St Unit 1 is a home located in Clark County with nearby schools including William G. Conkwright Elementary School, George Rogers Clark High School, and St. Agatha Academy.
Ownership History
Date
Name
Owned For
Owner Type
Purchase Details
Closed on
Jun 29, 2022
Sold by
Witham Darian and Witham Leo T
Bought by
Jones
Current Estimated Value
Home Financials for this Owner
Home Financials are based on the most recent Mortgage that was taken out on this home.
Original Mortgage
$202,500
Outstanding Balance
$190,605
Interest Rate
3.95%
Mortgage Type
Construction
Estimated Equity
$10,504
Purchase Details
Closed on
Mar 21, 2016
Sold by
Halo Inc
Bought by
Sasher Ison and Sasher Darian
Purchase Details
Closed on
Sep 1, 1999
Bought by
Halo Inc
Create a Home Valuation Report for This Property
The Home Valuation Report is an in-depth analysis detailing your home's value as well as a comparison with similar homes in the area
Home Values in the Area
Average Home Value in this Area
Purchase History
| Date | Buyer | Sale Price | Title Company |
|---|---|---|---|
| Jones | $225,000 | Attorney Only | |
| Sasher Ison | $52,000 | -- | |
| Halo Inc | $69,500 | -- |
Source: Public Records
Mortgage History
| Date | Status | Borrower | Loan Amount |
|---|---|---|---|
| Open | Jones | $202,500 |
Source: Public Records
Tax History Compared to Growth
Tax History
| Year | Tax Paid | Tax Assessment Tax Assessment Total Assessment is a certain percentage of the fair market value that is determined by local assessors to be the total taxable value of land and additions on the property. | Land | Improvement |
|---|---|---|---|---|
| 2024 | $2,050 | $205,000 | $15,000 | $190,000 |
| 2023 | $2,007 | $205,000 | $0 | $0 |
| 2022 | $591 | $60,000 | $0 | $0 |
| 2021 | $589 | $60,000 | $0 | $0 |
| 2020 | $591 | $60,000 | $0 | $0 |
| 2019 | $594 | $60,000 | $0 | $0 |
| 2018 | $586 | $60,000 | $0 | $0 |
| 2017 | $589 | $60,000 | $0 | $0 |
| 2016 | $76 | $52,000 | $0 | $0 |
| 2015 | $114 | $78,200 | $0 | $0 |
| 2013 | -- | $78,200 | $0 | $0 |
Source: Public Records
Map
Nearby Homes