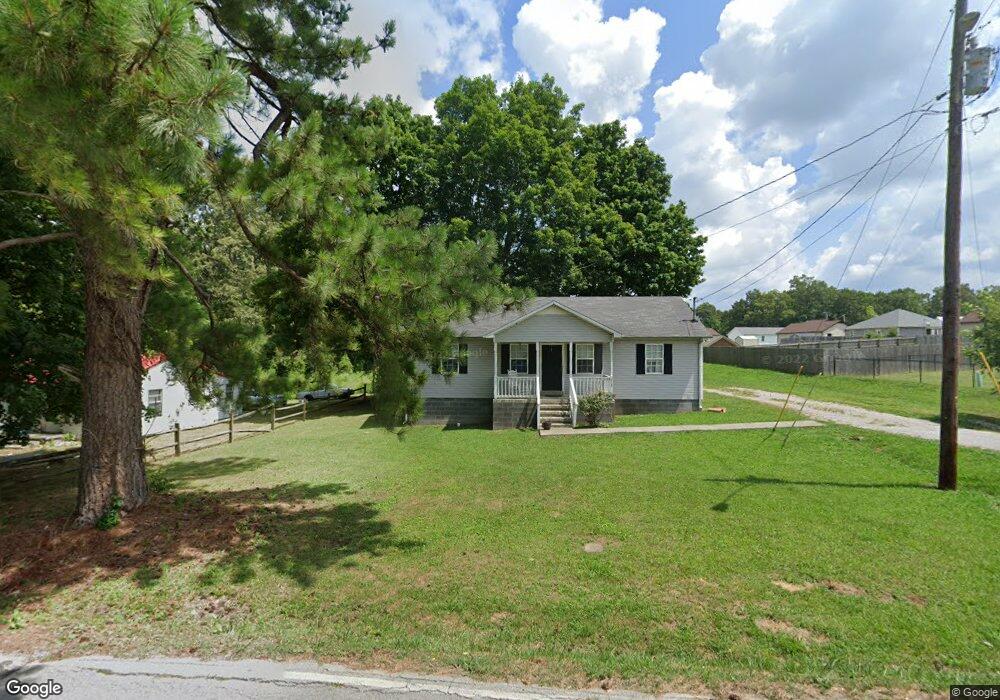
613 Oak Dr Manchester, TN 37355
Estimated Value: $142,000 - $206,000
--
Bed
2
Baths
1,118
Sq Ft
$163/Sq Ft
Est. Value
About This Home
This home is located at 613 Oak Dr, Manchester, TN 37355 and is currently estimated at $181,951, approximately $162 per square foot. 613 Oak Dr is a home located in Coffee County with nearby schools including Westwood Middle School and Temple Baptist Christian School.
Ownership History
Date
Name
Owned For
Owner Type
Purchase Details
Closed on
Sep 21, 2012
Sold by
Gray Diane
Bought by
Hardee Gus and Hardee Katherine A
Current Estimated Value
Purchase Details
Closed on
Mar 16, 2009
Sold by
Federal Home Loan Mortgage Corporation
Bought by
Bradford Ricky L
Purchase Details
Closed on
Jan 14, 2009
Bought by
Federal Home Loan Mortgage Corp Drawer Lr
Purchase Details
Closed on
Nov 1, 2004
Sold by
Lowe Jeff
Bought by
Botts Jasen S
Home Financials for this Owner
Home Financials are based on the most recent Mortgage that was taken out on this home.
Original Mortgage
$71,900
Interest Rate
5.65%
Create a Home Valuation Report for This Property
The Home Valuation Report is an in-depth analysis detailing your home's value as well as a comparison with similar homes in the area
Home Values in the Area
Average Home Value in this Area
Purchase History
| Date | Buyer | Sale Price | Title Company |
|---|---|---|---|
| Hardee Gus | -- | -- | |
| Bradford Ricky L | $68,000 | -- | |
| Federal Home Loan Mortgage Corp Drawer Lr | $58,700 | -- | |
| Botts Jasen S | $71,900 | -- |
Source: Public Records
Mortgage History
| Date | Status | Borrower | Loan Amount |
|---|---|---|---|
| Previous Owner | Botts Jasen S | $71,900 |
Source: Public Records
Tax History Compared to Growth
Tax History
| Year | Tax Paid | Tax Assessment Tax Assessment Total Assessment is a certain percentage of the fair market value that is determined by local assessors to be the total taxable value of land and additions on the property. | Land | Improvement |
|---|---|---|---|---|
| 2024 | $1,216 | $28,825 | $2,500 | $26,325 |
| 2023 | $1,216 | $28,825 | $0 | $0 |
| 2022 | $1,047 | $28,825 | $2,500 | $26,325 |
| 2021 | $996 | $21,750 | $1,500 | $20,250 |
| 2020 | $996 | $21,750 | $1,500 | $20,250 |
| 2019 | $996 | $21,750 | $1,500 | $20,250 |
| 2018 | $996 | $21,750 | $1,500 | $20,250 |
| 2017 | $1,010 | $19,250 | $1,500 | $17,750 |
| 2016 | $1,010 | $19,250 | $1,500 | $17,750 |
| 2015 | $1,010 | $19,250 | $1,500 | $17,750 |
| 2014 | $1,010 | $19,257 | $0 | $0 |
Source: Public Records
Map
Nearby Homes