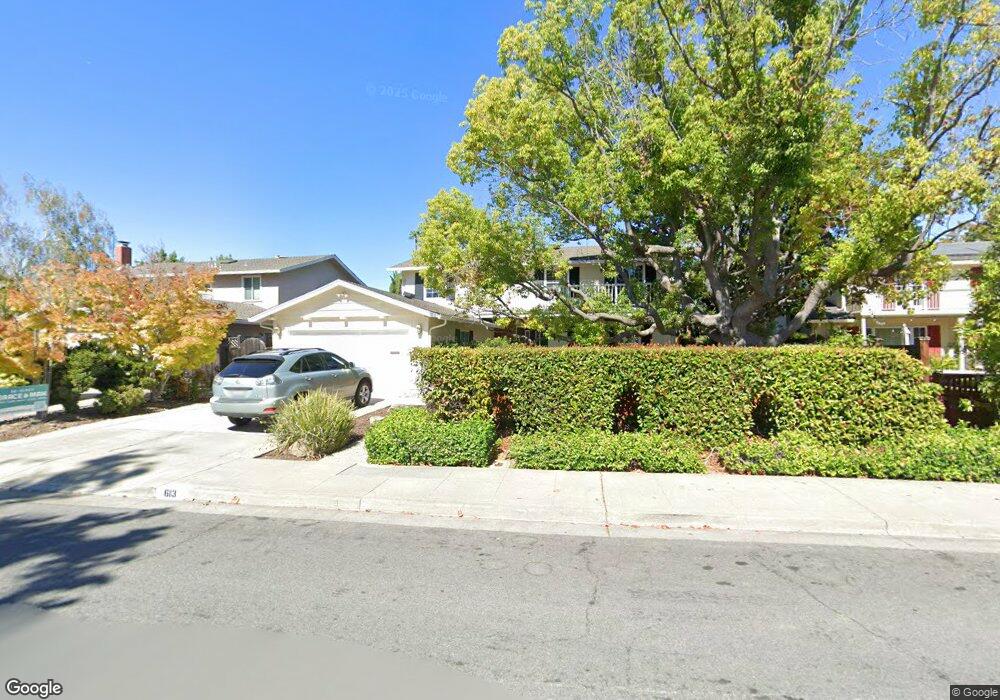
613 Princeton Dr Sunnyvale, CA 94087
Estimated Value: $2,955,550 - $3,331,000
6
Beds
3
Baths
2,270
Sq Ft
$1,398/Sq Ft
Est. Value
About This Home
This home is located at 613 Princeton Dr, Sunnyvale, CA 94087 and is currently estimated at $3,173,888, approximately $1,398 per square foot. 613 Princeton Dr is a home located in Santa Clara County with nearby schools including Cumberland Elementary School, Sunnyvale Middle School, and Fremont High School.
Ownership History
Date
Name
Owned For
Owner Type
Purchase Details
Closed on
Sep 28, 2012
Sold by
Jamgotchian Daryl
Bought by
Jamgotchian Daryl
Current Estimated Value
Purchase Details
Closed on
Jul 16, 2012
Sold by
Chin Lan
Bought by
Chin Lan
Purchase Details
Closed on
Mar 3, 2011
Sold by
Leong Raymond
Bought by
Jamgotchian Daryl and Chin Lan
Home Financials for this Owner
Home Financials are based on the most recent Mortgage that was taken out on this home.
Original Mortgage
$498,000
Outstanding Balance
$22,923
Interest Rate
4.75%
Mortgage Type
New Conventional
Estimated Equity
$3,150,965
Purchase Details
Closed on
Apr 20, 2001
Sold by
Leong Raymond
Bought by
Leong Raymond
Purchase Details
Closed on
Jun 26, 1998
Sold by
Raymond Leong
Bought by
Leong Raymond
Purchase Details
Closed on
Jun 18, 1998
Sold by
Raymond Leong
Bought by
Leong Raymond
Create a Home Valuation Report for This Property
The Home Valuation Report is an in-depth analysis detailing your home's value as well as a comparison with similar homes in the area
Home Values in the Area
Average Home Value in this Area
Purchase History
| Date | Buyer | Sale Price | Title Company |
|---|---|---|---|
| Jamgotchian Daryl | -- | None Available | |
| Chin Lan | -- | None Available | |
| Jamgotchian Daryl | $998,000 | Old Republic Title Company | |
| Leong Raymond | -- | Financial Title Company | |
| Leong Raymond | -- | Financial Title Company | |
| Leong Raymond | -- | Financial Title Company | |
| Leong Raymond | -- | -- | |
| Leong Raymond | -- | American Title Co |
Source: Public Records
Mortgage History
| Date | Status | Borrower | Loan Amount |
|---|---|---|---|
| Open | Jamgotchian Daryl | $498,000 |
Source: Public Records
Tax History Compared to Growth
Tax History
| Year | Tax Paid | Tax Assessment Tax Assessment Total Assessment is a certain percentage of the fair market value that is determined by local assessors to be the total taxable value of land and additions on the property. | Land | Improvement |
|---|---|---|---|---|
| 2025 | $14,613 | $1,278,600 | $767,163 | $511,437 |
| 2024 | $14,613 | $1,253,530 | $752,121 | $501,409 |
| 2023 | $14,442 | $1,228,952 | $737,374 | $491,578 |
| 2022 | $14,165 | $1,204,856 | $722,916 | $481,940 |
| 2021 | $14,020 | $1,181,233 | $708,742 | $472,491 |
| 2020 | $13,842 | $1,169,122 | $701,475 | $467,647 |
| 2019 | $13,531 | $1,146,199 | $687,721 | $458,478 |
| 2018 | $13,260 | $1,123,726 | $674,237 | $449,489 |
| 2017 | $13,089 | $1,101,693 | $661,017 | $440,676 |
| 2016 | $12,549 | $1,080,092 | $648,056 | $432,036 |
| 2015 | $12,624 | $1,063,869 | $638,322 | $425,547 |
| 2014 | $12,373 | $1,043,031 | $625,819 | $417,212 |
Source: Public Records
Map
Nearby Homes
- 654 Princeton Dr
- 128 Brahms Way
- 1262 Riesling Terrace
- 745 Reseda Dr
- 839 Springfield Terrace
- 541 Holthouse Terrace
- 857 Peach Ave
- 1308 Yarmouth Terrace
- 1243 E Fremont Terrace
- 960 Heatherstone Ave
- Plan 7 at Vida
- Plan 4 at Vida
- Plan 2 at Vida
- Plan 8 at Vida
- Plan 1 at Vida
- Plan 3 at Vida
- Plan 5 at Vida
- Plan 6 at Vida
- 1304 Barbet Cir Unit 6
- 1304 Barbet Cir Unit 1
- 617 Princeton Dr
- 609 Princeton Dr
- 618 Oneida Dr
- 623 Princeton Dr
- 605 Princeton Dr
- 899 Spinosa Dr
- 898 Savory Dr
- 622 Oneida Dr
- 612 Princeton Dr
- 608 Princeton Dr
- 618 Princeton Dr
- 897 Spinosa Dr
- 627 Princeton Dr
- 602 Princeton Dr
- 624 Princeton Dr
- 626 Oneida Dr
- 896 Savory Dr
- 895 Spinosa Dr
- 631 Princeton Dr
- 599 Sunnymount Ave