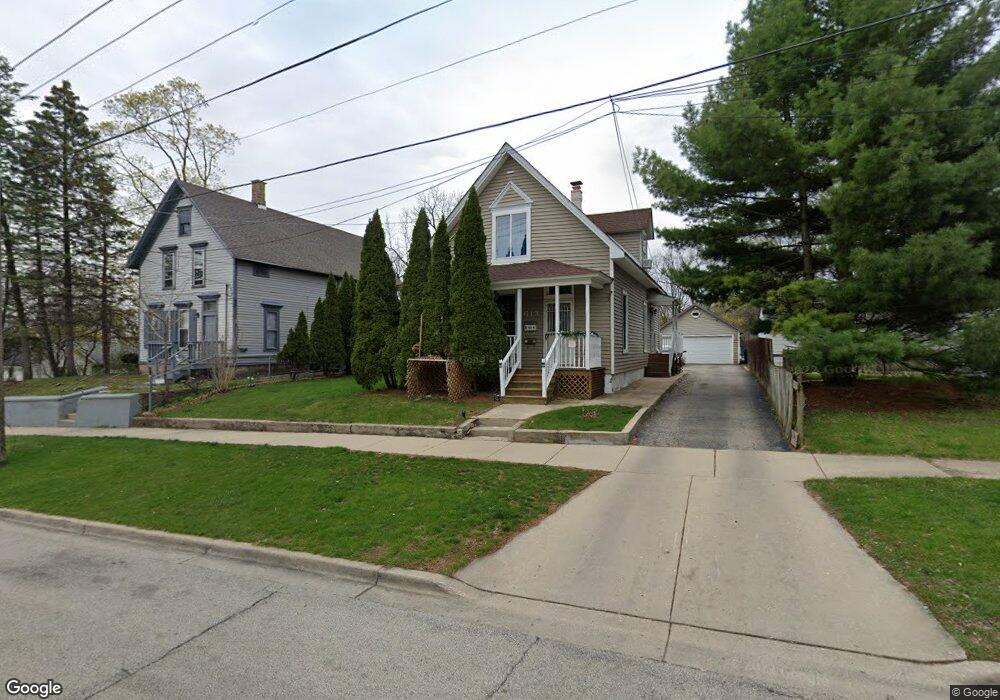
613 Sherman Ave Elgin, IL 60120
Southeast Elgin NeighborhoodEstimated Value: $284,000 - $295,138
5
Beds
2
Baths
1,698
Sq Ft
$171/Sq Ft
Est. Value
About This Home
This home is located at 613 Sherman Ave, Elgin, IL 60120 and is currently estimated at $290,785, approximately $171 per square foot. 613 Sherman Ave is a home located in Kane County with nearby schools including Huff Elementary School, Ellis Middle School, and Elgin High School.
Ownership History
Date
Name
Owned For
Owner Type
Purchase Details
Closed on
Oct 16, 2023
Sold by
Vargas Jose
Bought by
Mendoza Oscar J
Current Estimated Value
Purchase Details
Closed on
Apr 25, 2007
Sold by
Rodriguez Jaime and Magallanes Maria
Bought by
Vargas Jose
Home Financials for this Owner
Home Financials are based on the most recent Mortgage that was taken out on this home.
Original Mortgage
$242,155
Interest Rate
6.2%
Mortgage Type
Unknown
Purchase Details
Closed on
Jun 25, 1999
Sold by
Rodriguez Santos
Bought by
Magallanes Maria and Rodriguez Jaime
Purchase Details
Closed on
Jul 25, 1997
Sold by
Steffan Roger G and Steffan Carol L
Bought by
Rodriguez Santos and Magallanes Maria
Home Financials for this Owner
Home Financials are based on the most recent Mortgage that was taken out on this home.
Original Mortgage
$134,254
Interest Rate
7.71%
Mortgage Type
FHA
Create a Home Valuation Report for This Property
The Home Valuation Report is an in-depth analysis detailing your home's value as well as a comparison with similar homes in the area
Home Values in the Area
Average Home Value in this Area
Purchase History
| Date | Buyer | Sale Price | Title Company |
|---|---|---|---|
| Mendoza Oscar J | $260,000 | Chicago Title | |
| Vargas Jose | $255,000 | Chicago Title Insurance Co | |
| Magallanes Maria | -- | -- | |
| Rodriguez Santos | $90,666 | -- |
Source: Public Records
Mortgage History
| Date | Status | Borrower | Loan Amount |
|---|---|---|---|
| Previous Owner | Vargas Jose | $242,155 | |
| Previous Owner | Rodriguez Santos | $134,254 |
Source: Public Records
Tax History
| Year | Tax Paid | Tax Assessment Tax Assessment Total Assessment is a certain percentage of the fair market value that is determined by local assessors to be the total taxable value of land and additions on the property. | Land | Improvement |
|---|---|---|---|---|
| 2024 | $5,010 | $70,604 | $15,565 | $55,039 |
| 2023 | $4,756 | $63,786 | $14,062 | $49,724 |
| 2022 | $4,166 | $54,040 | $12,822 | $41,218 |
| 2021 | $3,972 | $50,524 | $11,988 | $38,536 |
| 2020 | $3,852 | $48,233 | $11,444 | $36,789 |
| 2019 | $3,731 | $45,945 | $10,901 | $35,044 |
| 2018 | $3,686 | $43,283 | $10,269 | $33,014 |
| 2017 | $3,591 | $40,918 | $9,708 | $31,210 |
| 2016 | $3,409 | $37,960 | $9,006 | $28,954 |
| 2015 | -- | $34,794 | $8,255 | $26,539 |
| 2014 | -- | $34,364 | $8,153 | $26,211 |
| 2013 | -- | $35,270 | $8,368 | $26,902 |
Source: Public Records
Map
Nearby Homes
- 457 Arlington Ave
- 631 Bent St
- 450 Villa St
- 689 Bent St
- 513 Cookane Ave
- 483 Barrett St
- 332-334 St Charles St
- 518 Raymond St
- 262 Bartlett Place
- 286 Villa St
- 277 Gifford Place
- 445 Lucile Ave
- 115 N Porter St
- 162 Festival Ct
- 7 National St Unit 7
- 3 National St Unit 3
- 211 Prairie St
- 833 Forest Ave
- 216 Prairie St
- 385 Woodview Cir Unit B
- 619 Sherman Ave Unit 21
- 407 S Liberty St
- 403 S Liberty St
- 411 S Liberty St
- 415 S Liberty St
- 627 Sherman Ave
- 423 S Liberty St
- 631 Sherman Ave
- 385 S Liberty St
- 612 Sherman Ave
- 618 Sherman Ave
- 410 Illinois Ave
- 635 Sherman Ave
- 418 Illinois Ave
- 624 Sherman Ave
- 427 S Liberty St Unit 29
- 381 S Liberty St
- 628 Sherman Ave
- 422 Illinois Ave
- 639 Sherman Ave
Your Personal Tour Guide
Ask me questions while you tour the home.