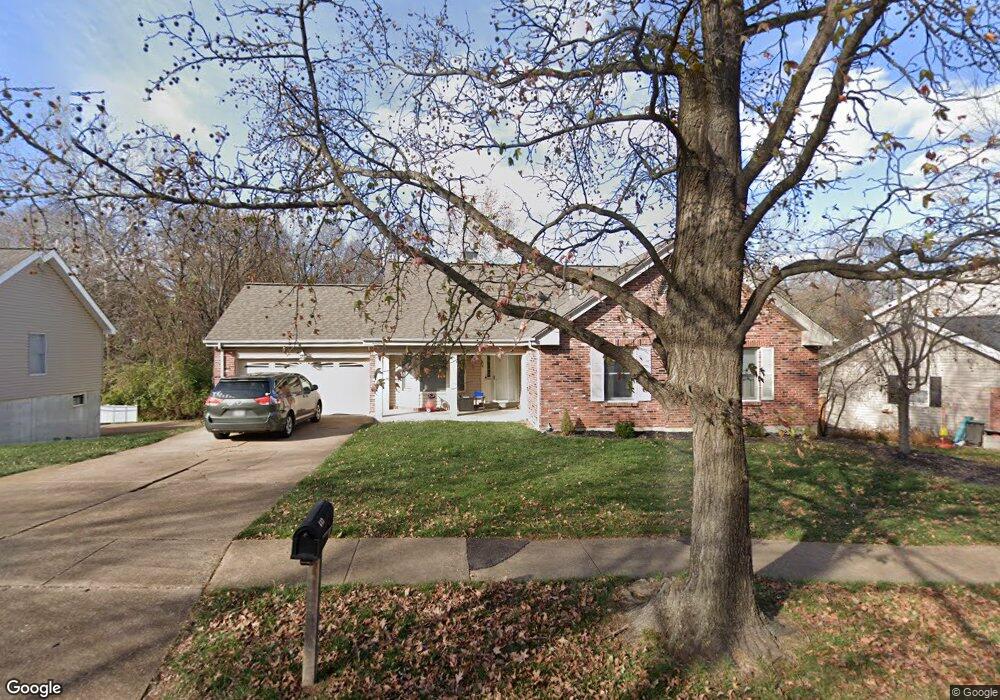
613 Valley Point Ln Ballwin, MO 63021
Estimated Value: $491,000 - $674,000
4
Beds
3
Baths
2,127
Sq Ft
$272/Sq Ft
Est. Value
About This Home
This home is located at 613 Valley Point Ln, Ballwin, MO 63021 and is currently estimated at $578,935, approximately $272 per square foot. 613 Valley Point Ln is a home located in St. Louis County with nearby schools including Barretts Elementary School, Parkway South Middle School, and Parkway South High School.
Ownership History
Date
Name
Owned For
Owner Type
Purchase Details
Closed on
May 30, 2013
Sold by
Gierse David and Gierse Tammy
Bought by
Schisler Donald and Schisler Laura
Current Estimated Value
Home Financials for this Owner
Home Financials are based on the most recent Mortgage that was taken out on this home.
Original Mortgage
$284,000
Outstanding Balance
$132,118
Interest Rate
3.41%
Mortgage Type
New Conventional
Estimated Equity
$446,817
Purchase Details
Closed on
Jan 30, 2003
Sold by
Dale James A and Dale Becky
Bought by
Redhage Tammy L
Home Financials for this Owner
Home Financials are based on the most recent Mortgage that was taken out on this home.
Original Mortgage
$150,000
Interest Rate
5.87%
Mortgage Type
Purchase Money Mortgage
Purchase Details
Closed on
Sep 28, 2001
Sold by
Hensz Charles W and Hensz Leslie K
Bought by
Dale James A and Dale Becky
Home Financials for this Owner
Home Financials are based on the most recent Mortgage that was taken out on this home.
Original Mortgage
$201,200
Interest Rate
6.88%
Create a Home Valuation Report for This Property
The Home Valuation Report is an in-depth analysis detailing your home's value as well as a comparison with similar homes in the area
Home Values in the Area
Average Home Value in this Area
Purchase History
| Date | Buyer | Sale Price | Title Company |
|---|---|---|---|
| Schisler Donald | $355,000 | Investors Title Co Clayton | |
| Redhage Tammy L | $272,400 | -- | |
| Dale James A | $251,500 | -- |
Source: Public Records
Mortgage History
| Date | Status | Borrower | Loan Amount |
|---|---|---|---|
| Open | Schisler Donald | $284,000 | |
| Previous Owner | Redhage Tammy L | $150,000 | |
| Previous Owner | Dale James A | $201,200 |
Source: Public Records
Tax History
| Year | Tax Paid | Tax Assessment Tax Assessment Total Assessment is a certain percentage of the fair market value that is determined by local assessors to be the total taxable value of land and additions on the property. | Land | Improvement |
|---|---|---|---|---|
| 2025 | $6,412 | $103,820 | $44,180 | $59,640 |
| 2024 | $6,412 | $98,910 | $28,270 | $70,640 |
| 2023 | $6,471 | $98,910 | $28,270 | $70,640 |
| 2022 | $6,047 | $84,680 | $28,270 | $56,410 |
| 2021 | $6,010 | $84,680 | $28,270 | $56,410 |
| 2020 | $5,950 | $80,140 | $24,740 | $55,400 |
| 2019 | $5,880 | $80,140 | $24,740 | $55,400 |
| 2018 | $5,201 | $65,550 | $19,610 | $45,940 |
| 2017 | $5,141 | $65,550 | $19,610 | $45,940 |
| 2016 | $5,270 | $63,730 | $17,710 | $46,020 |
Source: Public Records
Map
Nearby Homes
- 701 Boxwood Manor Ct
- 747 La Feil Dr
- 759 Carman Woods Dr
- 1730 Woodmore Oaks Dr
- 1602 Mauvering Ct
- 605 Waterford Ridge Ct
- 828 Carman Woods Dr
- 724 Le Manns Dr
- 1738 Highview Circle Ct
- 1872 Ridgeview Circle Dr
- 847 Weatherwood Dr
- 39 Ridgeview Circle Ct Unit 39
- 256 Glandore Dr Unit D
- 631 Loehr Estates Dr
- 1210 Wicklow Rd Unit L
- 1601 Country Hill Ln
- 1649 Country Hill Ln
- 622 Dougherty Terrace Dr
- 831 Windsor Gardens Ct
- 221 Braeshire Dr Unit B
- 619 Valley Point Ln
- 607 Valley Point Ln
- 1518 Carman Valley Dr
- 614 Valley Point Ln
- 625 Valley Point Ln
- 620 Valley Point Ln
- 608 Valley Point Ln
- 1531 Carman Valley Dr
- 1512 Carman Valley Dr
- 1519 Carman Valley Dr
- 624 Valley Point Ln
- 631 Valley Point Ln
- 1537 Carman Valley Dr
- 1544 Carman Valley Dr
- 566 Cool Dell Ct
- 649 Carman Meadows Dr
- 643 Carman Meadows Dr
- 1543 Carman Valley Dr
- 630 Valley Point Ln
- 560 Cool Dell Ct
Your Personal Tour Guide
Ask me questions while you tour the home.