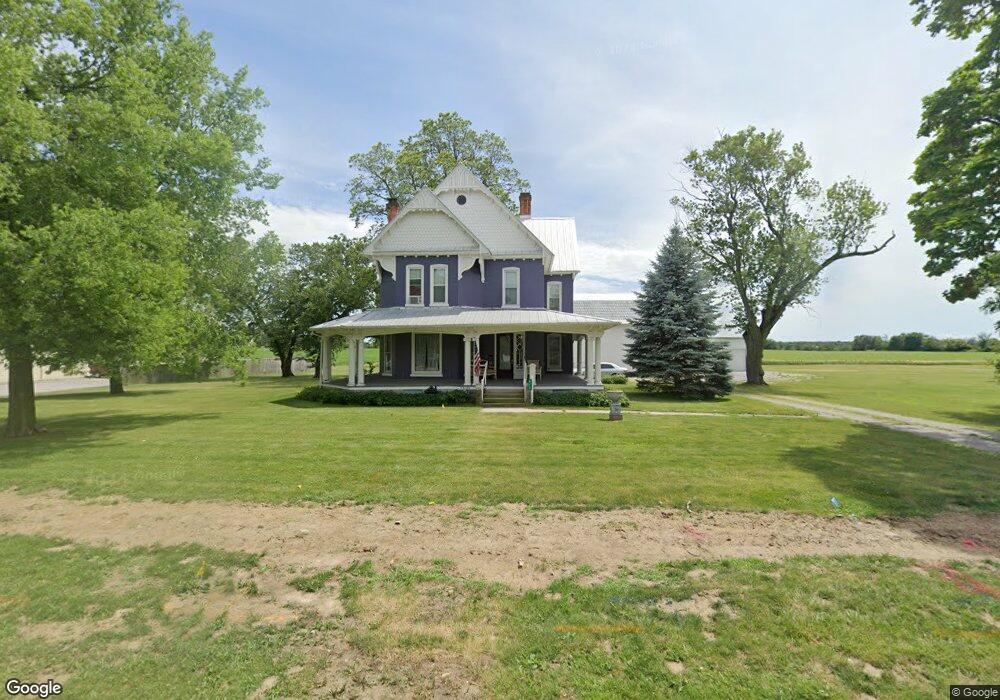
613 W Main St Fayette, OH 43521
Fayette NeighborhoodEstimated Value: $182,000 - $287,000
4
Beds
3
Baths
3,020
Sq Ft
$80/Sq Ft
Est. Value
About This Home
This home is located at 613 W Main St, Fayette, OH 43521 and is currently estimated at $242,506, approximately $80 per square foot. 613 W Main St is a home with nearby schools including Fayette Elementary School and Fayette Junior/Senior High School.
Ownership History
Date
Name
Owned For
Owner Type
Purchase Details
Closed on
Dec 14, 2018
Sold by
Stiriz Jane L
Bought by
Gable Gregory S and Mcneal Lorraine
Current Estimated Value
Home Financials for this Owner
Home Financials are based on the most recent Mortgage that was taken out on this home.
Original Mortgage
$141,391
Outstanding Balance
$124,568
Interest Rate
4.8%
Mortgage Type
FHA
Estimated Equity
$117,938
Purchase Details
Closed on
Jul 18, 2011
Sold by
Stiriz Donald L and Stiriz Jane L
Bought by
Stiriz Donald L and Stiriz Jane L
Purchase Details
Closed on
Jun 30, 2011
Sold by
Stiriz Donald L and Stiriz Jane L
Bought by
Tobe Robert V and Tobe Pamela A
Purchase Details
Closed on
Jul 8, 2010
Sold by
Stiriz Donald L and Stiriz Jane L
Bought by
Fayette Dg Llc
Home Financials for this Owner
Home Financials are based on the most recent Mortgage that was taken out on this home.
Original Mortgage
$654,100
Interest Rate
4.81%
Mortgage Type
Future Advance Clause Open End Mortgage
Purchase Details
Closed on
Jan 1, 1990
Bought by
Steinem William Acker
Create a Home Valuation Report for This Property
The Home Valuation Report is an in-depth analysis detailing your home's value as well as a comparison with similar homes in the area
Home Values in the Area
Average Home Value in this Area
Purchase History
| Date | Buyer | Sale Price | Title Company |
|---|---|---|---|
| Gable Gregory S | $144,000 | None Available | |
| Stiriz Donald L | -- | Attorney | |
| Tobe Robert V | $147,200 | None Available | |
| Fayette Dg Llc | $55,000 | Old Republic National Title | |
| Steinem William Acker | -- | -- |
Source: Public Records
Mortgage History
| Date | Status | Borrower | Loan Amount |
|---|---|---|---|
| Open | Gable Gregory S | $141,391 | |
| Previous Owner | Fayette Dg Llc | $654,100 |
Source: Public Records
Tax History Compared to Growth
Tax History
| Year | Tax Paid | Tax Assessment Tax Assessment Total Assessment is a certain percentage of the fair market value that is determined by local assessors to be the total taxable value of land and additions on the property. | Land | Improvement |
|---|---|---|---|---|
| 2024 | $3,325 | $68,470 | $16,420 | $52,050 |
| 2023 | $3,244 | $68,470 | $16,420 | $52,050 |
| 2022 | $3,056 | $53,730 | $13,690 | $40,040 |
| 2021 | $2,619 | $44,700 | $13,690 | $31,010 |
| 2020 | $2,591 | $44,700 | $13,690 | $31,010 |
| 2019 | $2,481 | $45,050 | $11,690 | $33,360 |
| 2018 | $2,336 | $45,050 | $11,690 | $33,360 |
| 2017 | $2,086 | $46,380 | $13,020 | $33,360 |
| 2016 | $2,216 | $47,570 | $12,080 | $35,490 |
| 2015 | $1,906 | $47,570 | $12,080 | $35,490 |
| 2014 | $1,898 | $47,570 | $12,080 | $35,490 |
| 2013 | $1,885 | $38,780 | $8,750 | $30,030 |
Source: Public Records
Map
Nearby Homes
- 505 N Gorham St
- 14701 Us Highway 127
- 26909 County Road Mn
- 21830 County Road T
- 23161 County Road Jk
- 15383 County Road 19
- 518 S Main St
- 400 S Main St
- 302 E Center St
- 13451 S Waldron Rd
- 10800 South Rd
- 0 County Road 21-50
- 22227 Us Highway 20a
- 14191 Lickley Rd
- 210 W Locust St
- 128 E Lagrange St
- 141 E Main St
- 403 N Summit St
- 114 W Walnut St
- 402 Pearl St
- 610 W Main St
- 612 W Main St
- 24519 Us Highway 20
- 24526 Us Highway 20
- 604 W Main St
- 601 W Main St
- 104 S Walnut St
- 202 S Walnut St
- 506 W Main St
- 507 W Main St
- 204 S Walnut St
- 24614 Us Highway 20
- 206 S Walnut St
- 505 W Main St
- 504 W Main St
- 208 S Walnut St
- 503 W Main St
- 210 S Walnut St
- 102 College St
- 501 W Main St