Estimated Value: $158,000
2
Beds
1
Bath
840
Sq Ft
$188/Sq Ft
Est. Value
About This Home
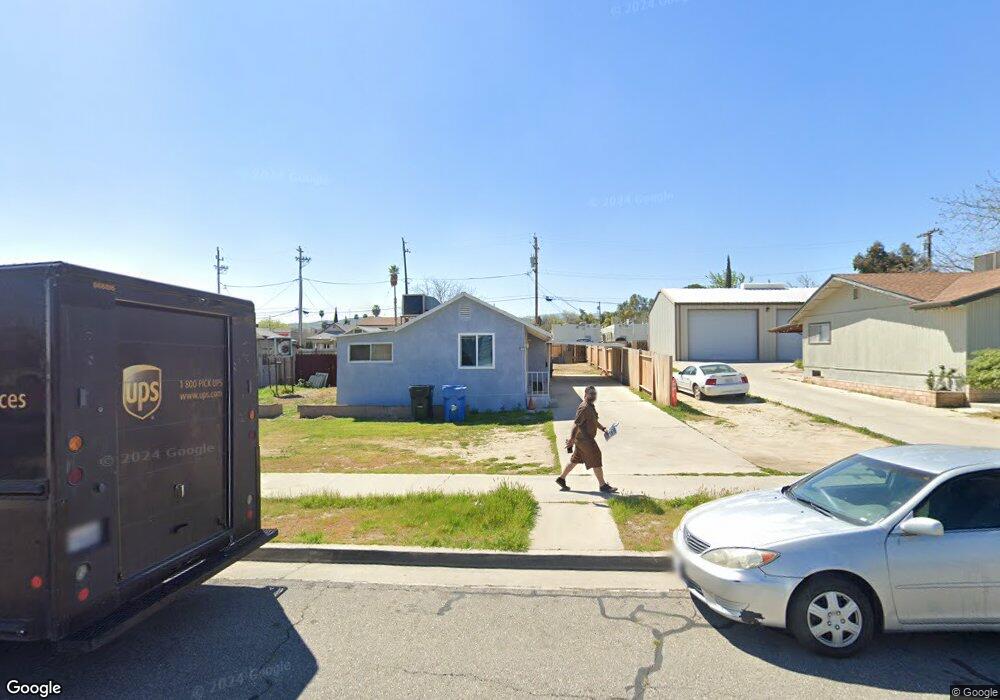
This home is located at 613 Warren St, Taft, CA 93268 and is currently estimated at $158,000, approximately $188 per square foot. 613 Warren St is a home located in Kern County with nearby schools including Roosevelt Elementary School, Taft Primary School, and Lincoln Junior High School.
Ownership History
Date
Name
Owned For
Owner Type
Purchase Details
Closed on
Sep 15, 2025
Sold by
Lampkin Roger N and Lampkin Eunice K
Bought by
Lampkin-Johnson Family Trust and Lampkin
Current Estimated Value
Purchase Details
Closed on
Mar 11, 2022
Sold by
Wildharber Family Trust
Bought by
Lampkin Roger N and Lampkin Eunice K
Purchase Details
Closed on
Nov 8, 2007
Sold by
Wildharber James P and Wildharber Allie E
Bought by
Wildharber James P and Wildharber Allie E
Purchase Details
Closed on
May 8, 2007
Sold by
Wildharber James P and The Mildred Wildharber Irrevoc
Bought by
Wildharber James P and Wildharber Allie E
Purchase Details
Closed on
Nov 29, 2006
Sold by
Wildharber James P and The Mildred Wildharber Trust
Bought by
Wildharber James P and The Mildred Wildharber Irrevoc
Purchase Details
Closed on
Jan 17, 1995
Sold by
Wildharber Mildred
Bought by
Wildharber Mildred and Mildred Wildharber Trust
Create a Home Valuation Report for This Property
The Home Valuation Report is an in-depth analysis detailing your home's value as well as a comparison with similar homes in the area
Home Values in the Area
Average Home Value in this Area
Purchase History
| Date | Buyer | Sale Price | Title Company |
|---|---|---|---|
| Lampkin-Johnson Family Trust | -- | None Listed On Document | |
| Lampkin Roger N | $190,000 | Ticor Title | |
| Wildharber James P | -- | None Available | |
| Wildharber James P | -- | None Available | |
| Wildharber James P | -- | None Available | |
| Wildharber Mildred | -- | -- |
Source: Public Records
Tax History
| Year | Tax Paid | Tax Assessment Tax Assessment Total Assessment is a certain percentage of the fair market value that is determined by local assessors to be the total taxable value of land and additions on the property. | Land | Improvement |
|---|---|---|---|---|
| 2025 | $1,930 | $54,121 | $15,918 | $38,203 |
| 2024 | $1,766 | $53,060 | $15,606 | $37,454 |
| 2023 | $1,766 | $52,020 | $15,300 | $36,720 |
| 2022 | $1,164 | $9,893 | $7,211 | $2,682 |
| 2021 | $1,015 | $9,700 | $7,070 | $2,630 |
| 2020 | $1,015 | $9,602 | $6,998 | $2,604 |
| 2019 | $845 | $9,602 | $6,998 | $2,604 |
| 2018 | $843 | $9,230 | $6,727 | $2,503 |
| 2017 | $838 | $9,050 | $6,596 | $2,454 |
| 2016 | $809 | $8,873 | $6,467 | $2,406 |
| 2015 | $759 | $8,740 | $6,370 | $2,370 |
| 2014 | $710 | $8,570 | $6,246 | $2,324 |
Source: Public Records
Map
Nearby Homes
Your Personal Tour Guide
Ask me questions while you tour the home.