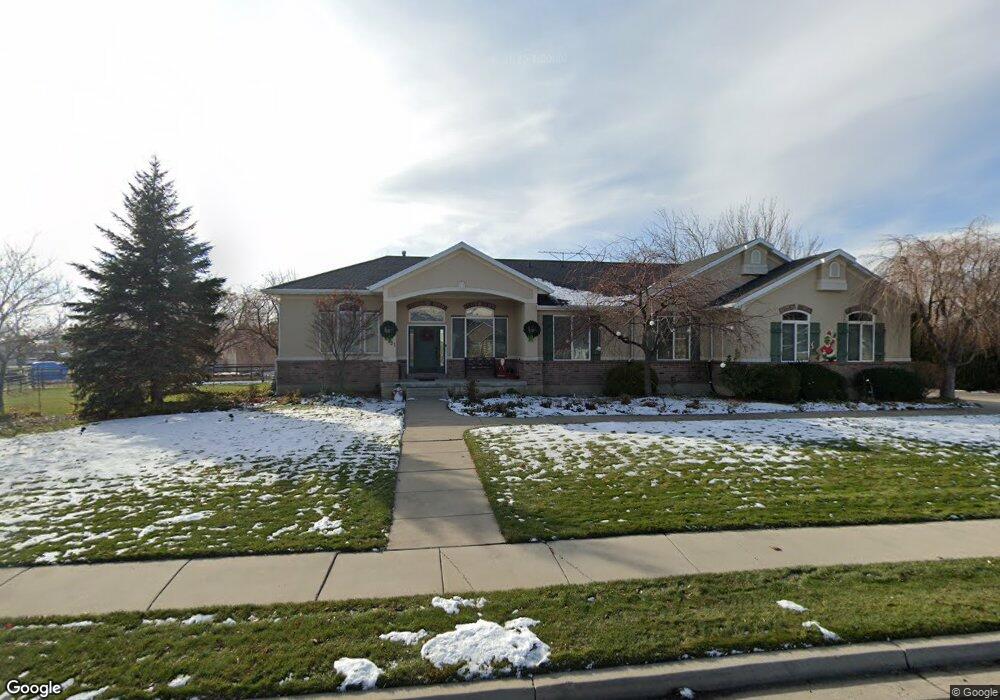
6131 W 10150 N Highland, UT 84003
Estimated Value: $960,000 - $1,508,000
6
Beds
3
Baths
2,039
Sq Ft
$559/Sq Ft
Est. Value
About This Home
This home is located at 6131 W 10150 N, Highland, UT 84003 and is currently estimated at $1,139,872, approximately $559 per square foot. 6131 W 10150 N is a home located in Utah County with nearby schools including Freedom Elementary School, Mountain Ridge Junior High School, and American Fork High School.
Ownership History
Date
Name
Owned For
Owner Type
Purchase Details
Closed on
Sep 15, 2025
Sold by
Bradshaw Michael and Bradshaw Sharlan
Bought by
Henrichsen Jay
Current Estimated Value
Purchase Details
Closed on
Oct 23, 1998
Sold by
T & R Corp
Bought by
Bradshaw Michael and Bradshaw Sharlan
Home Financials for this Owner
Home Financials are based on the most recent Mortgage that was taken out on this home.
Original Mortgage
$207,150
Interest Rate
6.6%
Create a Home Valuation Report for This Property
The Home Valuation Report is an in-depth analysis detailing your home's value as well as a comparison with similar homes in the area
Home Values in the Area
Average Home Value in this Area
Purchase History
| Date | Buyer | Sale Price | Title Company |
|---|---|---|---|
| Henrichsen Jay | -- | None Listed On Document | |
| Bradshaw Michael | -- | First American Title |
Source: Public Records
Mortgage History
| Date | Status | Borrower | Loan Amount |
|---|---|---|---|
| Previous Owner | Bradshaw Michael | $207,150 |
Source: Public Records
Tax History Compared to Growth
Tax History
| Year | Tax Paid | Tax Assessment Tax Assessment Total Assessment is a certain percentage of the fair market value that is determined by local assessors to be the total taxable value of land and additions on the property. | Land | Improvement |
|---|---|---|---|---|
| 2025 | $3,896 | $505,670 | $427,500 | $491,900 |
| 2024 | $3,896 | $481,195 | $0 | $0 |
| 2023 | $3,723 | $496,045 | $0 | $0 |
| 2022 | $3,579 | $462,385 | $0 | $0 |
| 2021 | $3,288 | $632,800 | $258,600 | $374,200 |
| 2020 | $3,117 | $588,200 | $224,900 | $363,300 |
| 2019 | $2,739 | $540,800 | $224,900 | $315,900 |
| 2018 | $2,558 | $480,000 | $205,300 | $274,700 |
| 2017 | $2,367 | $237,105 | $0 | $0 |
| 2016 | $2,235 | $209,220 | $0 | $0 |
| 2015 | $2,298 | $203,885 | $0 | $0 |
| 2014 | $2,132 | $187,440 | $0 | $0 |
Source: Public Records
Map
Nearby Homes